Free Access
Fig. A.3
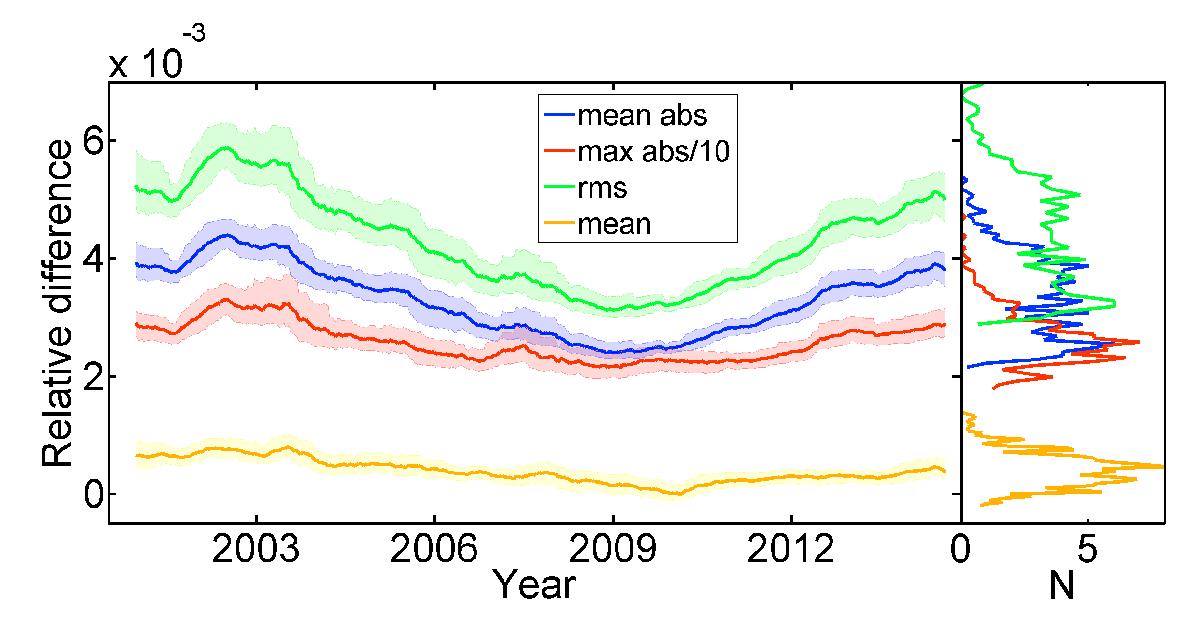
Left: relative difference between the contrast image retrieved using our method and original undegraded data for all images of subset 1 (disc positions within 0.98 R). Labels are as in Fig. A.2. Right: distribution functions of the difference values.
Current usage metrics show cumulative count of Article Views (full-text article views including HTML views, PDF and ePub downloads, according to the available data) and Abstracts Views on Vision4Press platform.
Data correspond to usage on the plateform after 2015. The current usage metrics is available 48-96 hours after online publication and is updated daily on week days.
Initial download of the metrics may take a while.