Fig. 13
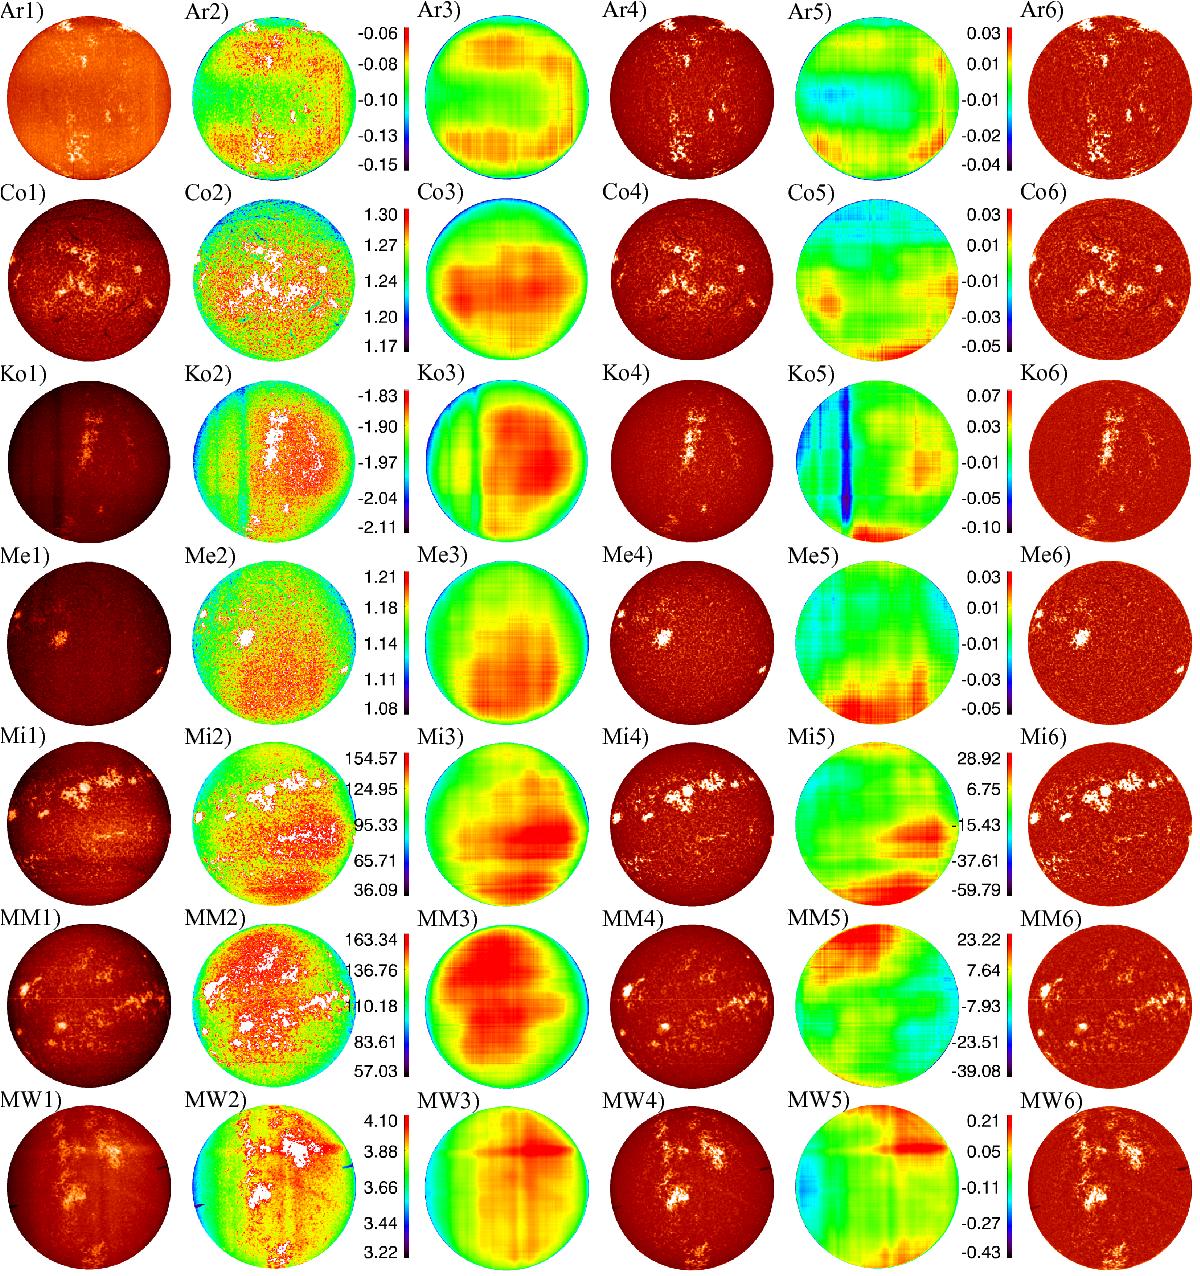
Examples of the calibration procedure of historical images from the Ar, Co, Ko, Me, Mi, MM, MW archives (from top to bottom) taken at high activity periods. From left to right: (1) density images, (2) density images saturated such as to clearly show the backgrounds, (3) calculated backgrounds (CLV and inhomogeneities), (4) calibrated images, (5) identified inhomogeneities, and (6) images corrected for QS CLV. All the unprocessed density images are shown with the whole range of densities within the disc, the calibrated images are shown within the intensity range [0.0, 2.0], while the contrast images (that is images compensated for the CLV) are plotted within [−0.5, 0.5]. A colour bar gives the density/intensity range for the rest of the images. The colour bar between images (2) and (3) applies to both images.
Current usage metrics show cumulative count of Article Views (full-text article views including HTML views, PDF and ePub downloads, according to the available data) and Abstracts Views on Vision4Press platform.
Data correspond to usage on the plateform after 2015. The current usage metrics is available 48-96 hours after online publication and is updated daily on week days.
Initial download of the metrics may take a while.