Free Access
Fig. 3
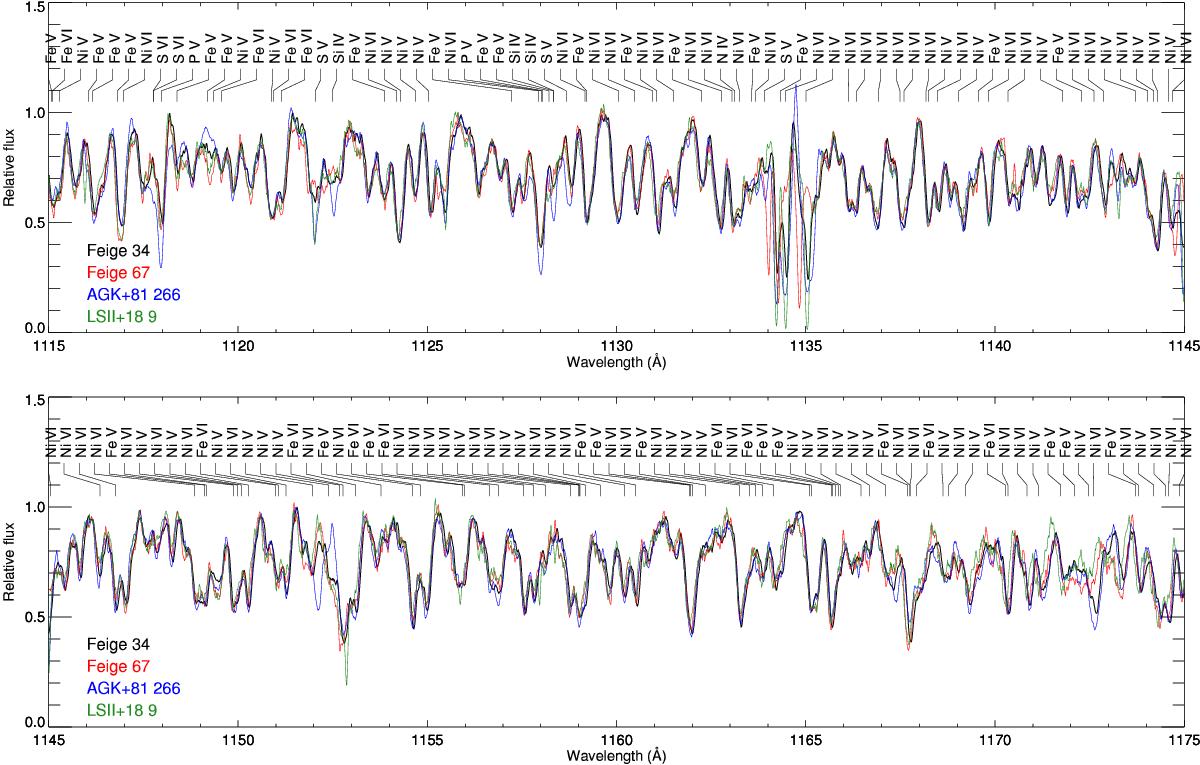
Comparison between the FUSE spectra of our four stars. The observed spectra are smoothed with a moving average over three pixels for better visualization and are shifted to the rest wavelength. Also shown are labels identifying the strongest lines in our linelist.
This figure is made of several images, please see below:
Current usage metrics show cumulative count of Article Views (full-text article views including HTML views, PDF and ePub downloads, according to the available data) and Abstracts Views on Vision4Press platform.
Data correspond to usage on the plateform after 2015. The current usage metrics is available 48-96 hours after online publication and is updated daily on week days.
Initial download of the metrics may take a while.