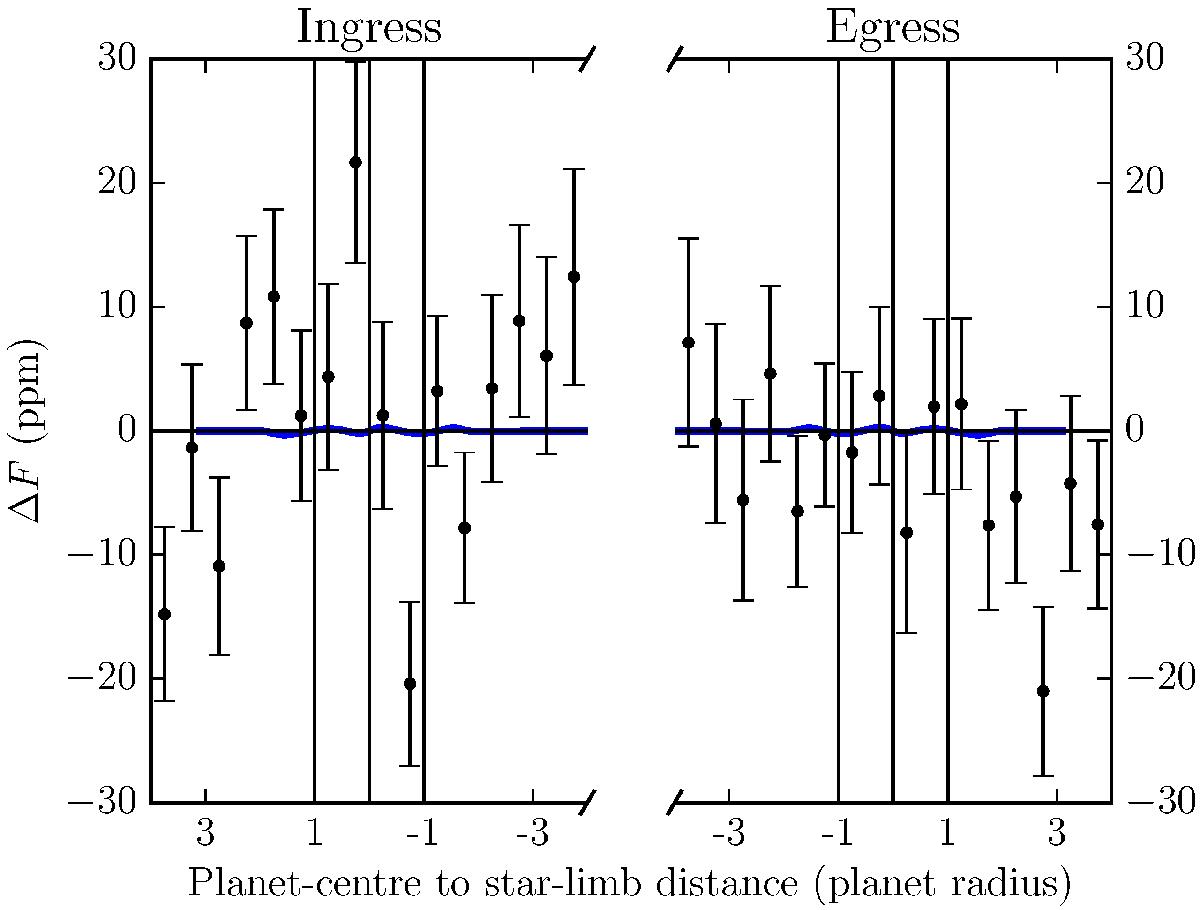
Fig. 9

Binned residuals for the sample of large planets on long orbits. Contrary to Fig. 8, the x-axis is the distance from the stellar limb to the planet centre in units of planet radii. The blue line is the theoretical prediction for a Jovian planet on a 20-day orbit. It is equivalent to the blue line in Fig. 4 as observed through the 30-min long cadence of Kepler. Negative distances are when planets are inside of the stellar disc and positive distances are outside. The vertical black lines mark when the planet limb and centre cross the star limb.
Current usage metrics show cumulative count of Article Views (full-text article views including HTML views, PDF and ePub downloads, according to the available data) and Abstracts Views on Vision4Press platform.
Data correspond to usage on the plateform after 2015. The current usage metrics is available 48-96 hours after online publication and is updated daily on week days.
Initial download of the metrics may take a while.


