Fig. 4
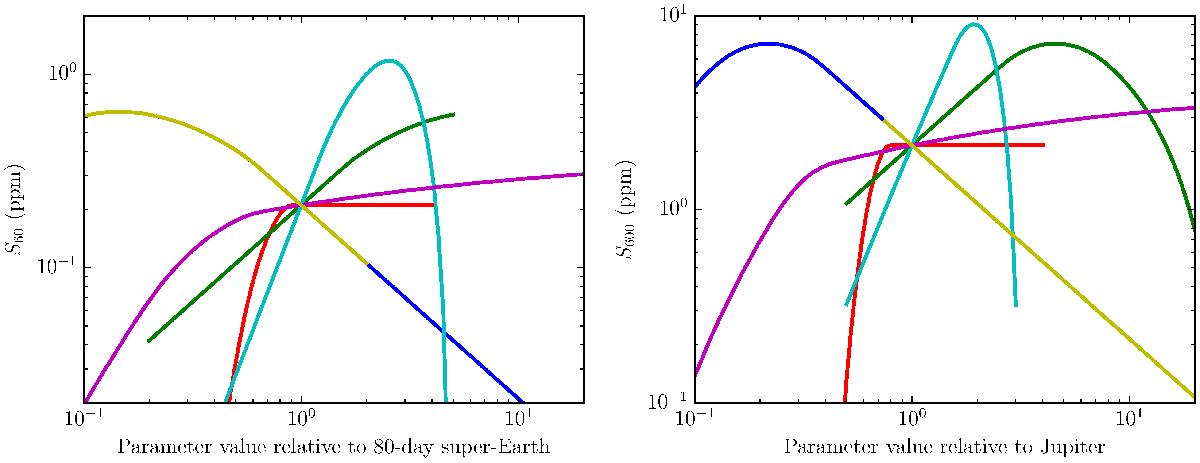
Refraction signal strengths as functions of six different refraction parameters. The left panel is the 80-day super-Earth and the right panel is Jupiter. The x-axis is the ratio of the changing parameter to its original value. Red is wavelength, green is temperature, blue is planet mass, cyan is radius, magenta is orbital distance, and yellow is molecular weight (which overlaps with planet mass). The signal is measured over 60 min for the 80-day super-Earth and 600 min for Jupiter because of the different characteristic timescales.
Current usage metrics show cumulative count of Article Views (full-text article views including HTML views, PDF and ePub downloads, according to the available data) and Abstracts Views on Vision4Press platform.
Data correspond to usage on the plateform after 2015. The current usage metrics is available 48-96 hours after online publication and is updated daily on week days.
Initial download of the metrics may take a while.