Fig. 4
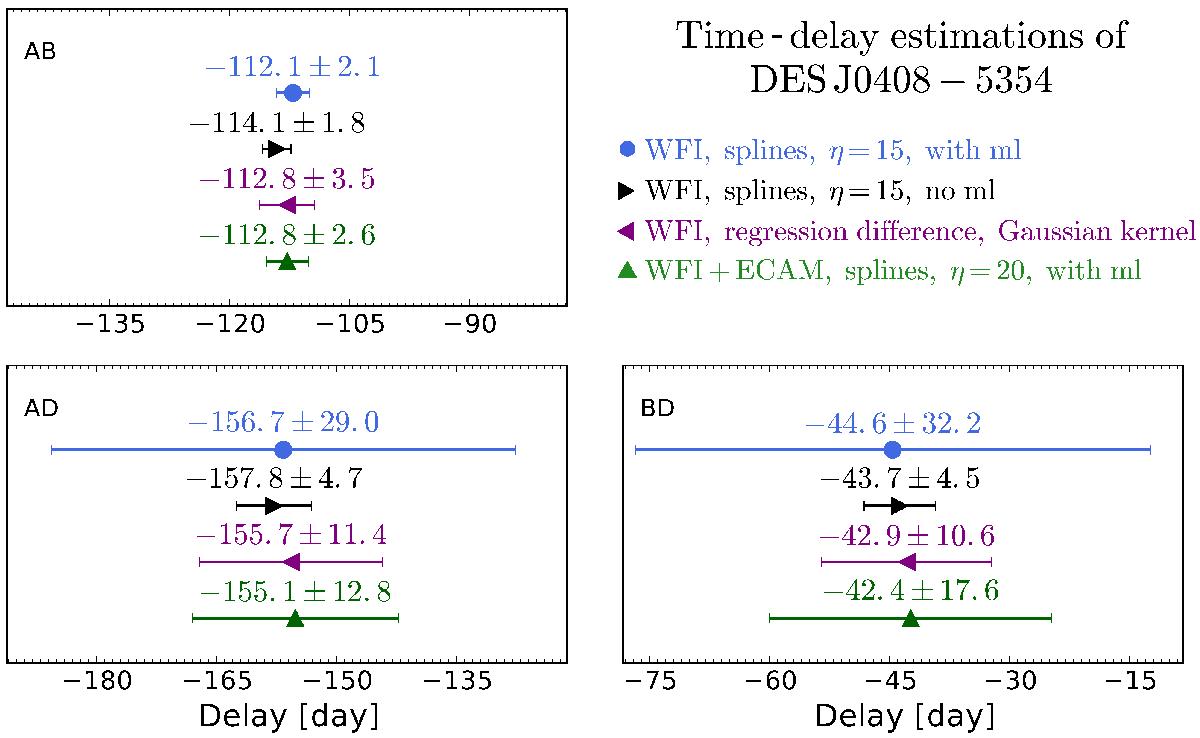
Time delay measurements for the 3 brightest quasar images of DES J0408−5354 using the data shown in Fig. 3. The time delay measurements are carried out in 3 different ways. Results using the WFI data with the spline fitting method are shown in blue and those in purple show the regression difference method. Results for the combined WFI+Euler data set using the spline fitting method are shown in green. For comparison we also show, in black, the spline fitting result when using only the high-cadence WFI data and no model for the microlensing extrinsic variations. A negative Δt(AB) means that the signal from image A reaches the observer’s plane before B.
Current usage metrics show cumulative count of Article Views (full-text article views including HTML views, PDF and ePub downloads, according to the available data) and Abstracts Views on Vision4Press platform.
Data correspond to usage on the plateform after 2015. The current usage metrics is available 48-96 hours after online publication and is updated daily on week days.
Initial download of the metrics may take a while.