Fig. 3
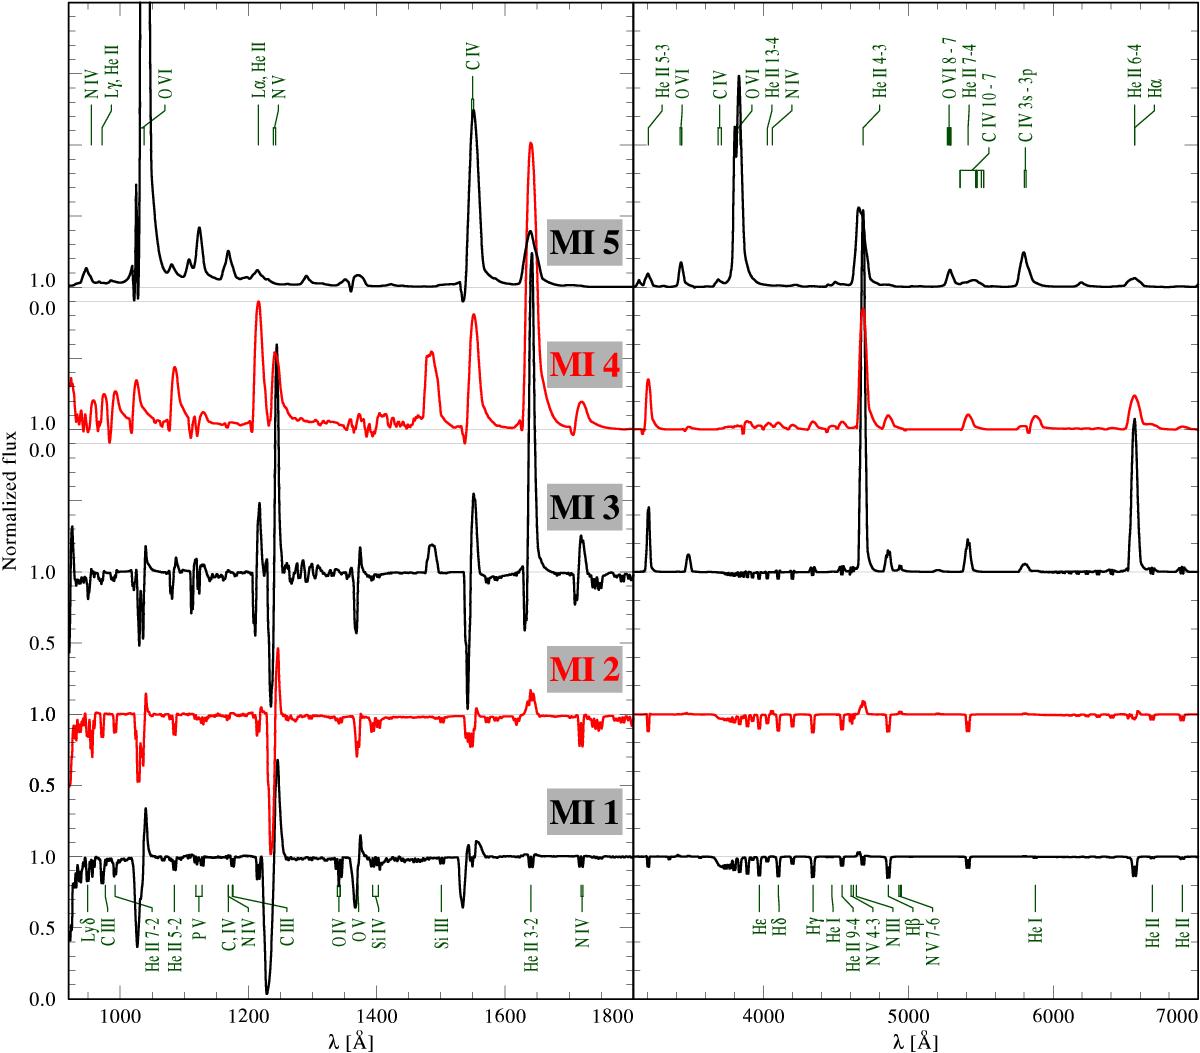
Sequence of synthetic spectra at five different evolutionary stages (marked by the identifiers also used in Fig. 1 and Table 1) of a massive star with initial mass 60 M⊙ evolving quasi-homogeneously at Z = 0.1 Z⊙ (Marchant track I). The continuum levels and the zero lines are indicated by horizontal thin gray lines. The time series starts at the bottom with the spectrum of the model at the ZAMS. To facilitate a comparison with observed spectra, the model spectra are convolved with a Gaussian profile with a FWHM of 1.0 Å.
Current usage metrics show cumulative count of Article Views (full-text article views including HTML views, PDF and ePub downloads, according to the available data) and Abstracts Views on Vision4Press platform.
Data correspond to usage on the plateform after 2015. The current usage metrics is available 48-96 hours after online publication and is updated daily on week days.
Initial download of the metrics may take a while.