Fig. 8
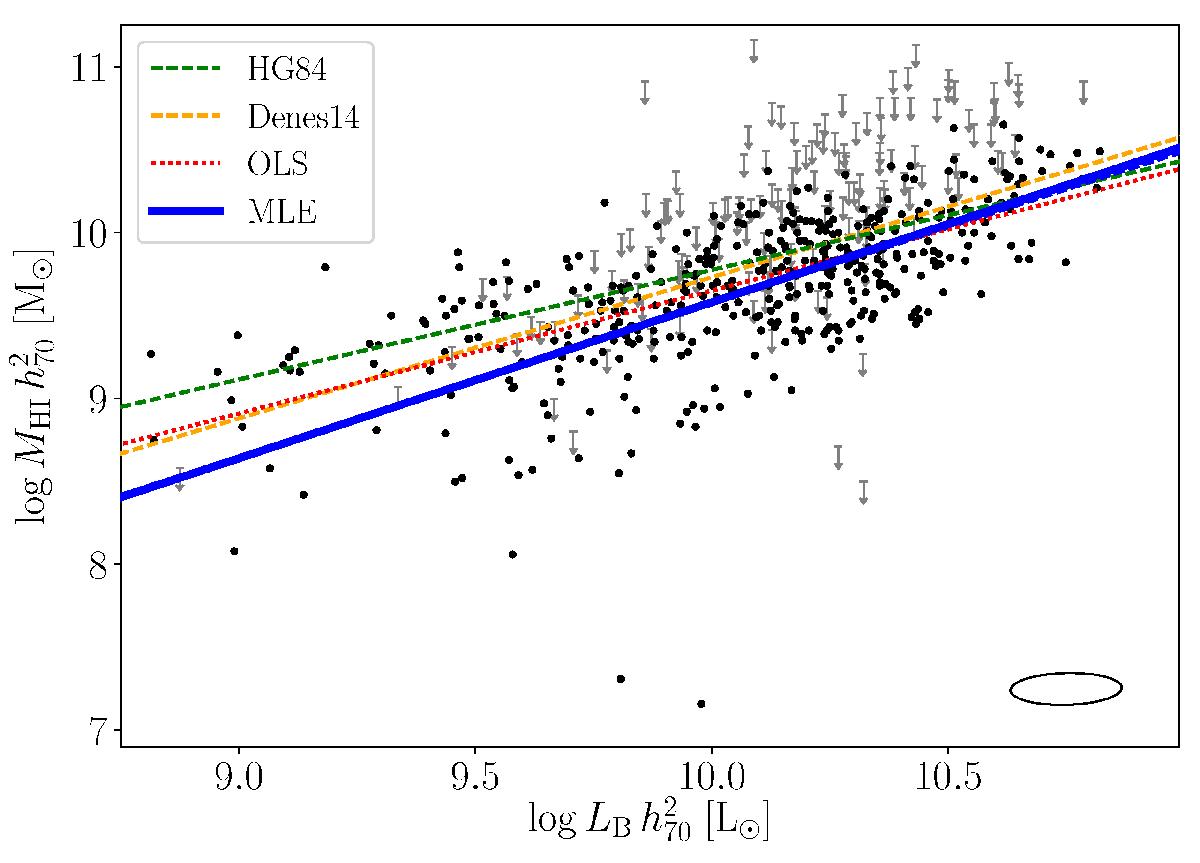
Scatter plot of the HI mass of AMIGA galaxies as a function of their optical luminosities (in B-band). The black points indicate sources detected in HI while grey arrows indicate upper limits. The typical 1σ error ellipse of the data points is shown in the bottom right corner. The heavy blue lines show the regression fits of this work. The solid line corresponds to the full regression model including upper limits, while the dashed line is for the same model but only including detections (mostly hidden behind the solid line). The red dotted line is the ordinary least squares fit for the detections only. The green and orange dashed lines are from HG84 and Dénes et al. (2014).
Current usage metrics show cumulative count of Article Views (full-text article views including HTML views, PDF and ePub downloads, according to the available data) and Abstracts Views on Vision4Press platform.
Data correspond to usage on the plateform after 2015. The current usage metrics is available 48-96 hours after online publication and is updated daily on week days.
Initial download of the metrics may take a while.