Fig. 6
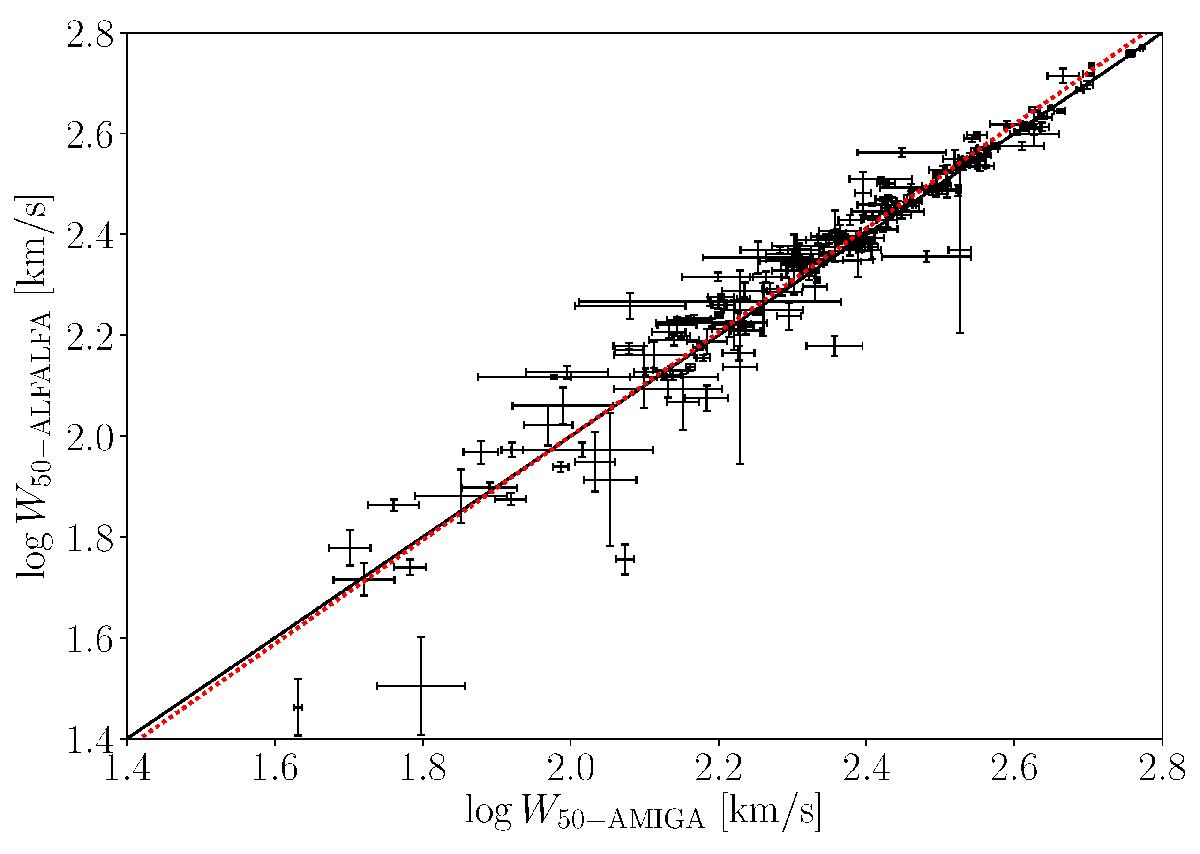
Comparison between ALFALFA and AMIGA measurements of HI profile widths at the 50% level. The black line indicates equality and the dotted red line the best fit to the data. The highly outlying points are either from low signal-to-noise detections, or sources where the profile shapes in ALFALFA and AMIGA have differences for unknown reasons.
Current usage metrics show cumulative count of Article Views (full-text article views including HTML views, PDF and ePub downloads, according to the available data) and Abstracts Views on Vision4Press platform.
Data correspond to usage on the plateform after 2015. The current usage metrics is available 48-96 hours after online publication and is updated daily on week days.
Initial download of the metrics may take a while.