Fig. 5
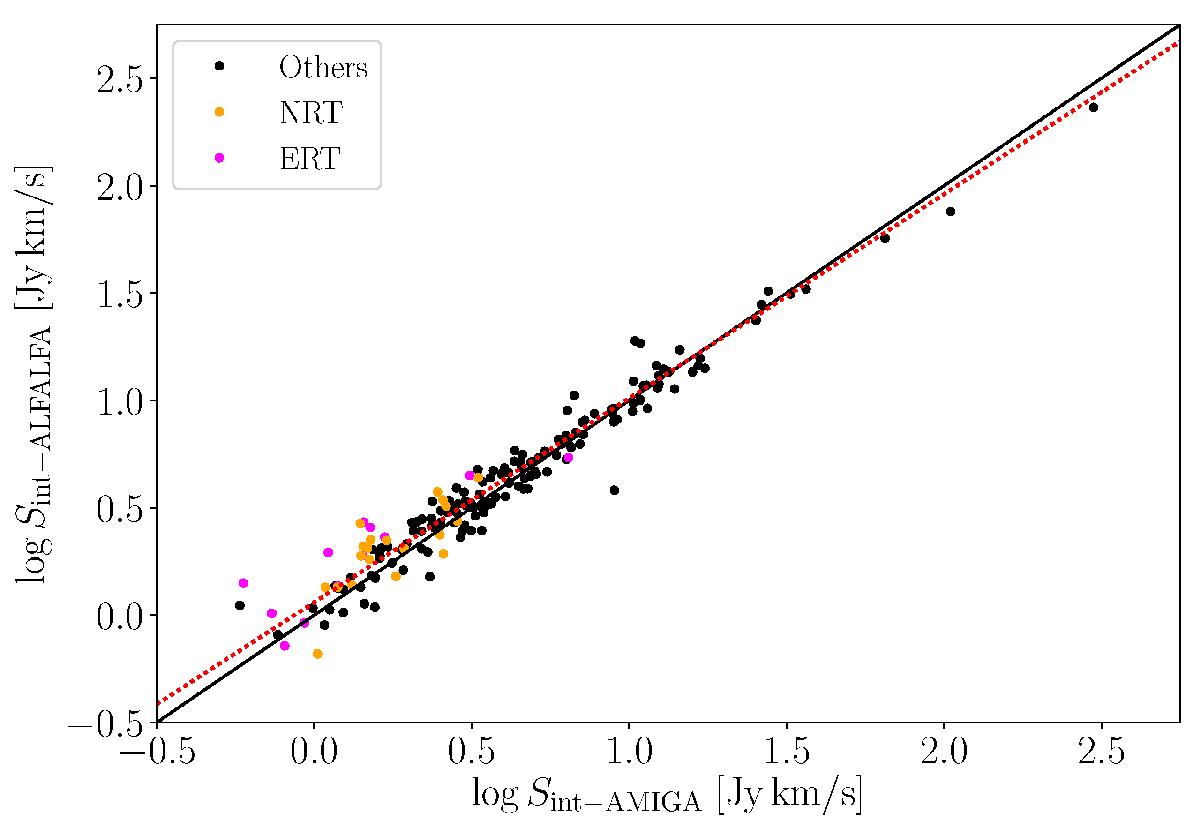
Comparison between ALFALFA and AMIGA measurements of HI integrated flux. The orange and pink points show detections from NRT and ERT respectively, and the black points show detections from all other telescopes. The thin black line indicates equality, while the dotted red line shows the best fit to all the points. Statistical error bars are not shown as for the majority of the points these are comparable in size to the points themselves, indicating that absolute calibration is the cause of most of the scatter and offset.
Current usage metrics show cumulative count of Article Views (full-text article views including HTML views, PDF and ePub downloads, according to the available data) and Abstracts Views on Vision4Press platform.
Data correspond to usage on the plateform after 2015. The current usage metrics is available 48-96 hours after online publication and is updated daily on week days.
Initial download of the metrics may take a while.