Fig. F.1
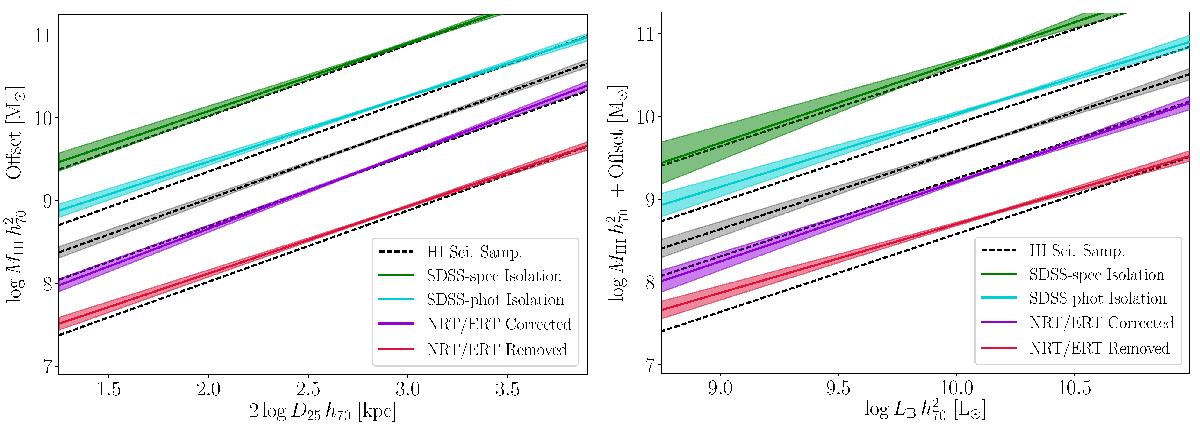
The D25 (left) and LB (right) relations along with 1σ uncertainties (shaded regions) for the HI science sample (dashed black line), the sample with SDSS spectroscopic isolation criteria (light blue), the sample with SDSS photometric isolation criteria (green), the HI science sample with corrected NRT and ERT fluxes (purple), and with NRT and ERT observations removed (red). Offsets have been applied to the relations (except the central relation, the HI science sample) to aid readability. The HI science sample relation is duplicated each time for comparison.
Current usage metrics show cumulative count of Article Views (full-text article views including HTML views, PDF and ePub downloads, according to the available data) and Abstracts Views on Vision4Press platform.
Data correspond to usage on the plateform after 2015. The current usage metrics is available 48-96 hours after online publication and is updated daily on week days.
Initial download of the metrics may take a while.