Fig. 13
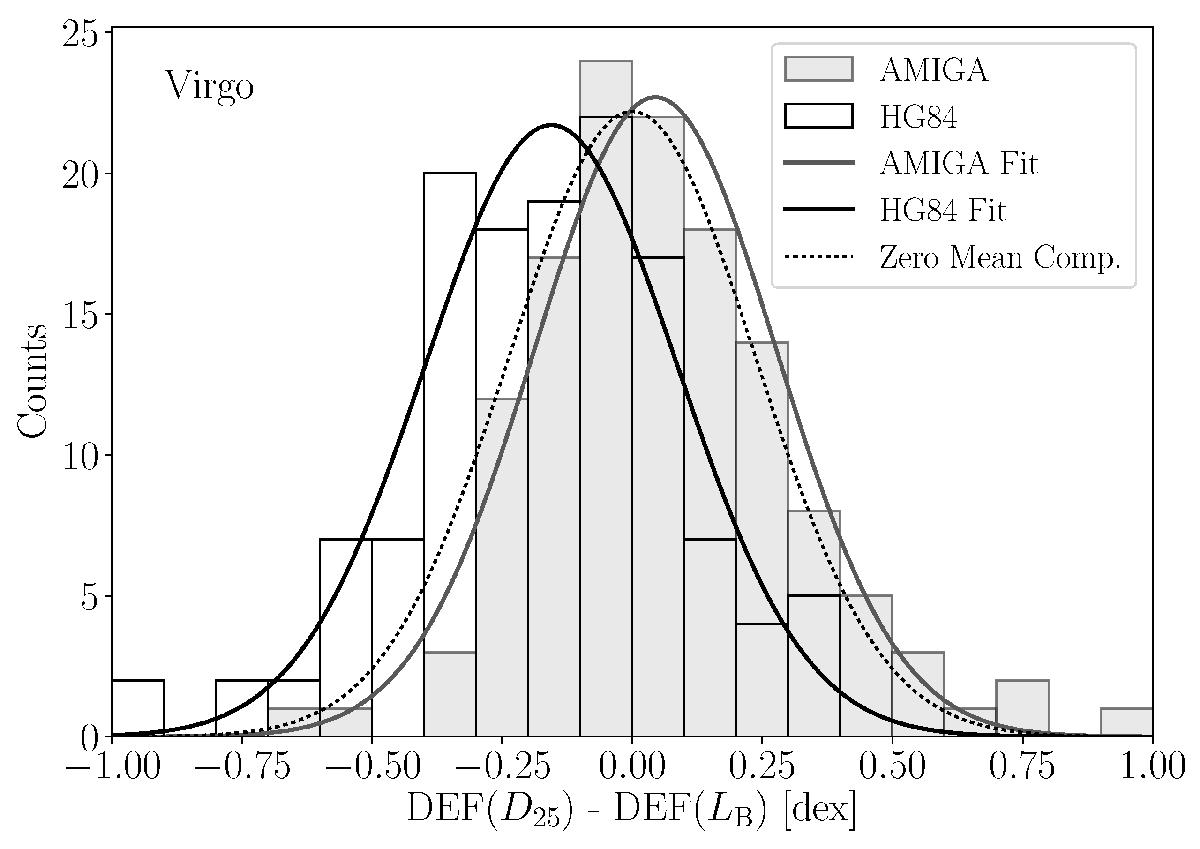
Comparison of the differences between the HI-deficiencies of Virgo cluster galaxies derived using the D25 and LB relations of this work (grey bars) and the differences using the HG84 relations (unfilled bars). The Gaussian fit to our values is shown with the grey solid line, the fit to the HG84 values is shown with the solid black line. A third Gaussian with zero mean and a width taken to be the average of the two fits, is shown for comparison by the dotted line.
Current usage metrics show cumulative count of Article Views (full-text article views including HTML views, PDF and ePub downloads, according to the available data) and Abstracts Views on Vision4Press platform.
Data correspond to usage on the plateform after 2015. The current usage metrics is available 48-96 hours after online publication and is updated daily on week days.
Initial download of the metrics may take a while.