Fig. 11
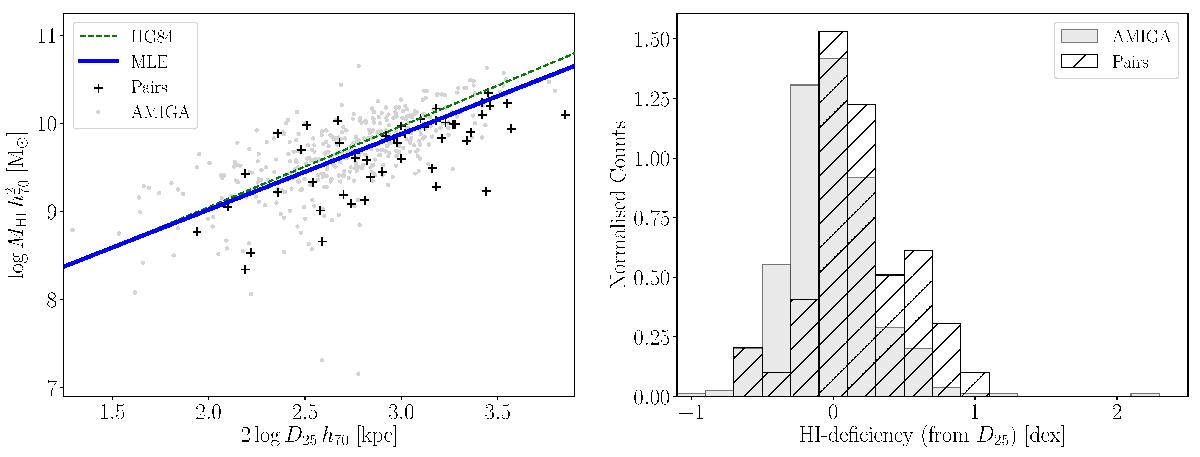
Left: scatter plot of the HI masses of isolated galaxy pairs as a function of their optical diameters (data from Zasov & Sulentic 1994), shown with black crosses. The light grey points in the background are the HI detections of the AMIGA HI science sample. The solid blue line shows the MLE regression fit of this work and the dashed green line shows the HG84 relation. Right: HI-deficiency of isolated galaxy pairs (diagonal hatching) compared to the AMIGA HI science sample (light grey). HI-deficiency here is calculated with the D25-relation (without use of morphological type).
Current usage metrics show cumulative count of Article Views (full-text article views including HTML views, PDF and ePub downloads, according to the available data) and Abstracts Views on Vision4Press platform.
Data correspond to usage on the plateform after 2015. The current usage metrics is available 48-96 hours after online publication and is updated daily on week days.
Initial download of the metrics may take a while.