Free Access
Fig. 9
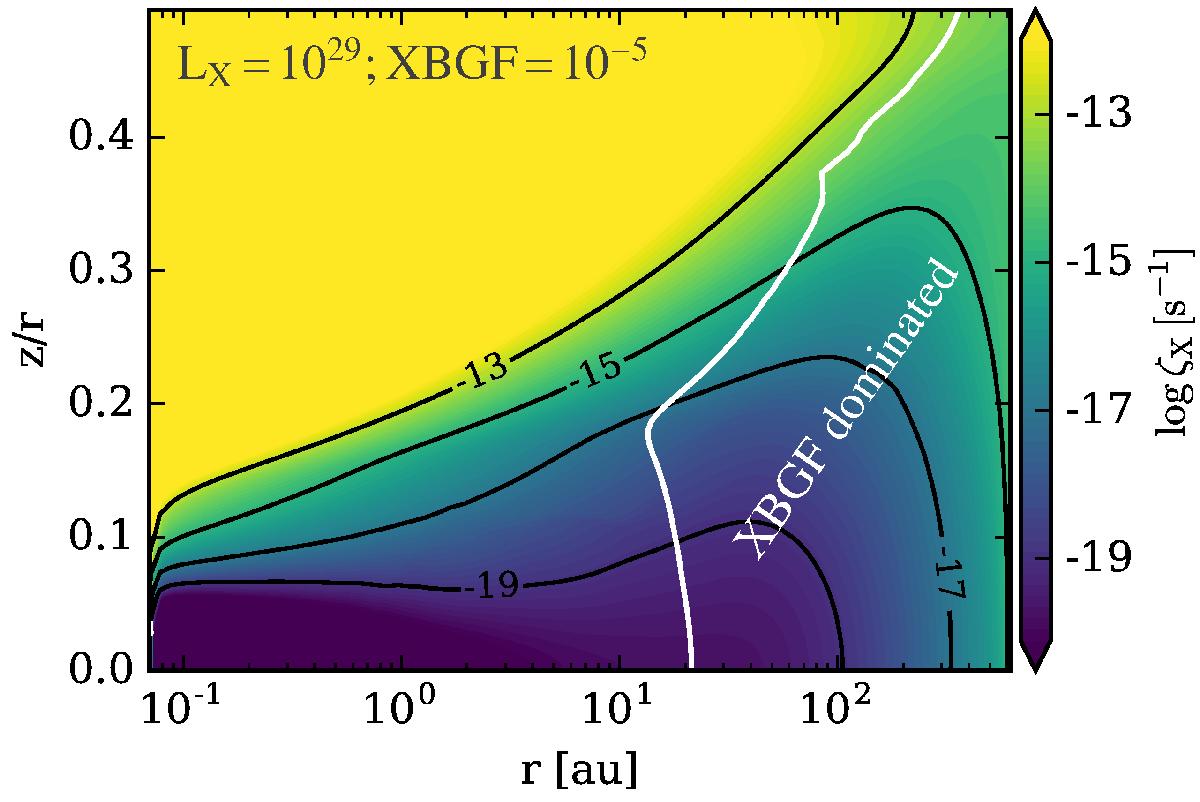
X-ray ionization rate ζX for a model with LX = 1029 erg s-1 and FXBGF = 2 × 10⁻⁵ erg cm-2 s-1 (i.e. the benchmark values of Adams et al. 2012). The white solid contour line encloses the region where the XBGF dominates ζX (i.e. ζX,XBGF ≥ ζX, ∗).
Current usage metrics show cumulative count of Article Views (full-text article views including HTML views, PDF and ePub downloads, according to the available data) and Abstracts Views on Vision4Press platform.
Data correspond to usage on the plateform after 2015. The current usage metrics is available 48-96 hours after online publication and is updated daily on week days.
Initial download of the metrics may take a while.