Fig. 7
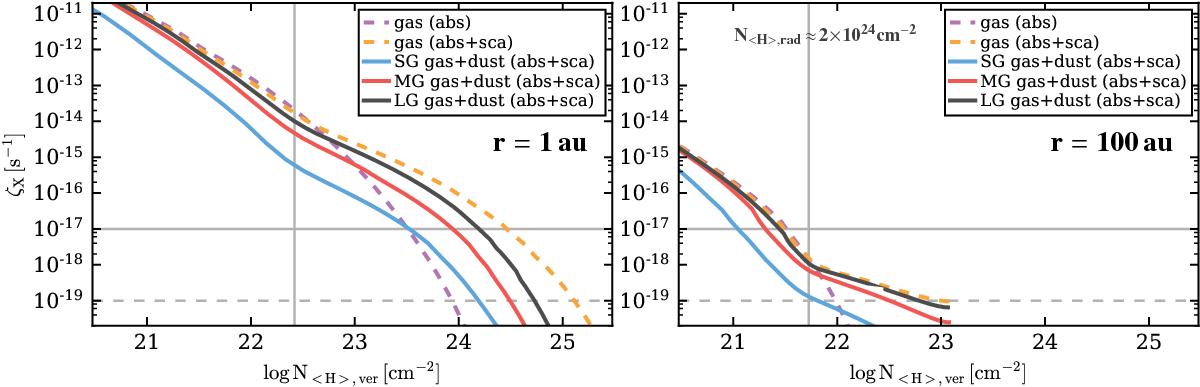
X-ray ionization rate ζX vs. vertical column density N⟨ H ⟩ ,ver at disk radii of 1 au (left panel) and 100 au (right panel), respectively. The dashed lines show models with X-ray gas opacities only, where the purple line is for pure absorption and the orange line for absorption plus scattering. The solid lines are for models including X-ray dust opacities (absorption+scattering), where results for the small grains (SG, blue), medium grains (MG, red) and large grains (LG, black) dust models are shown. The vertical grey line in both plots indicates the scattering surface at N⟨ H ⟩ ,rad = 2 × 1024 cm-2 (see also Fig. 6); at the right hand side of this line ζX is dominated by scattered high-energy photons. The horizontal lines mark the cosmic-ray ionization rates for the ISM (ζCR ≈ 10-17), and low cosmic-ray case (ζCR ≈ 10-19 s-1).
Current usage metrics show cumulative count of Article Views (full-text article views including HTML views, PDF and ePub downloads, according to the available data) and Abstracts Views on Vision4Press platform.
Data correspond to usage on the plateform after 2015. The current usage metrics is available 48-96 hours after online publication and is updated daily on week days.
Initial download of the metrics may take a while.