Fig. 4
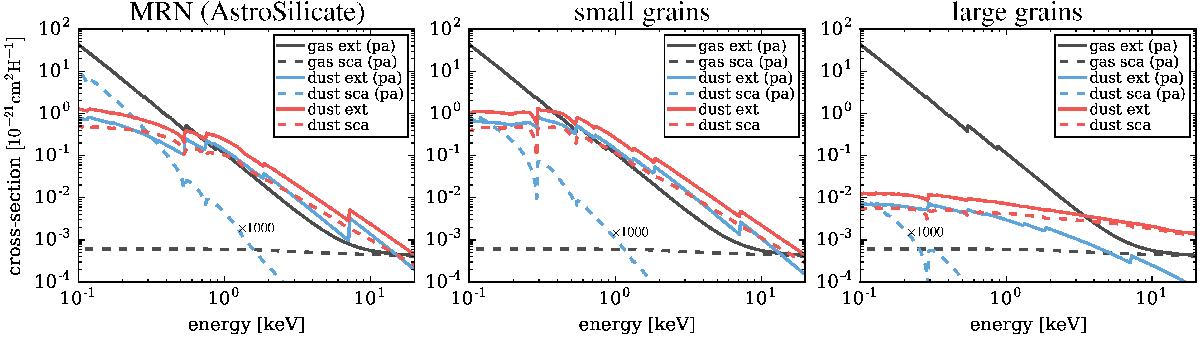
X-ray cross-sections for the gas (black lines) and dust (blue and red lines) per hydrogen nucleus for three different dust-size distributions. The solid lines show the extinction (absorption+scattering) cross section and the dashed lines are the scattering cross sections. The left panel is for the MRN size distribution (Mathis et al. 1977) using pure astronomical silicates (Draine 2003). The two other panels are for the small and large grains dust models (see Sect. 2.2.1). For the dust, the red lines are for isotropic and the blue lines for pseudo anisotropic (pa) scattering (see Sect. 2.3.2). The pseudo anisotropic scattering values (blue dashed lines) are multiplied by a factor of 1000. The shown gas cross-sections are the same in all three panels.
Current usage metrics show cumulative count of Article Views (full-text article views including HTML views, PDF and ePub downloads, according to the available data) and Abstracts Views on Vision4Press platform.
Data correspond to usage on the plateform after 2015. The current usage metrics is available 48-96 hours after online publication and is updated daily on week days.
Initial download of the metrics may take a while.