Fig. 2
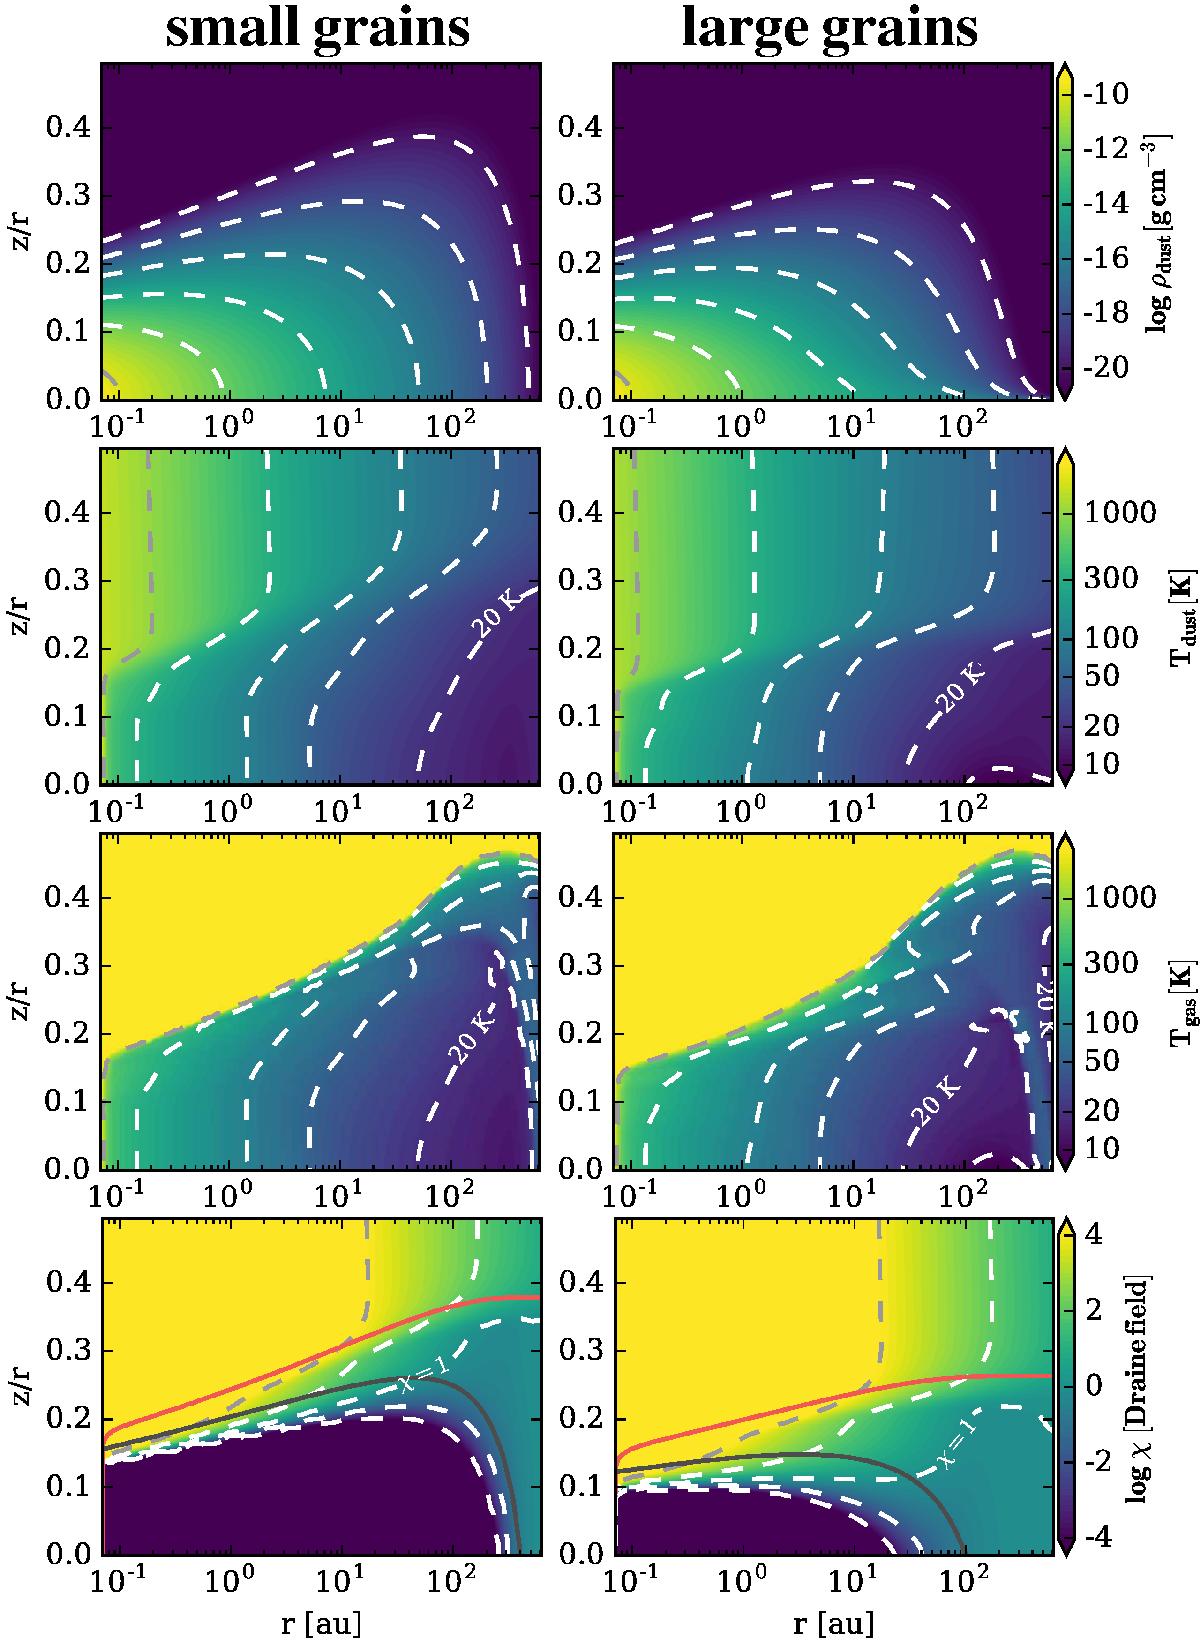
Large grains (left column) and small grains (right column) disk model. From top to bottom the dust density, dust temperature, gas temperature and the disk UV radiation field χ in units of the Draine field are shown. The dashed contours in each plot correspond to the levels shown in the respective colour bar. The additional contours in the UV plots (bottom row) indicate where the radial (red solid line) and vertical (black solid line) visual extinctions are equal to unity. For both models, the same gas density structure as shown in Fig. 1 is used.
Current usage metrics show cumulative count of Article Views (full-text article views including HTML views, PDF and ePub downloads, according to the available data) and Abstracts Views on Vision4Press platform.
Data correspond to usage on the plateform after 2015. The current usage metrics is available 48-96 hours after online publication and is updated daily on week days.
Initial download of the metrics may take a while.