Fig. B.1
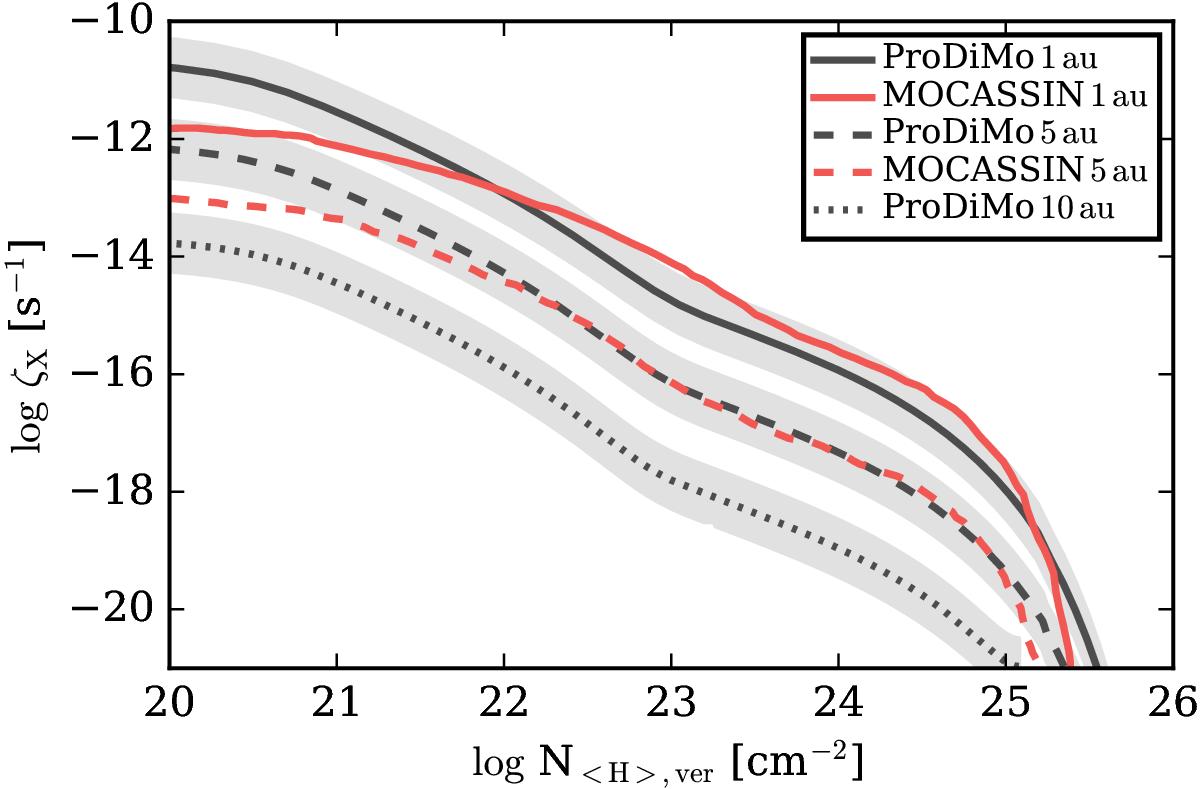
Comparison of the X-ray ionization rate ζX as a function of vertical hydrogen column density N⟨ H ⟩ ,ver at radii of 1 au (solid lines), 5 au (dashed lines) and 10 au (dotted line). The red lines are the results from MOCASSIN the black lines are the results from PRODIMO. The 10 au result from MOCASSIN were not available for this test case. The 10 au results have been scaled down by a factor of 10 for better visibility. The grey shaded area indicates a factor of three deviation relative to the PRODIMO results. An isothermal X-ray spectrum with kTX = 5 keV and LX = 1029 erg s-1 is used.
Current usage metrics show cumulative count of Article Views (full-text article views including HTML views, PDF and ePub downloads, according to the available data) and Abstracts Views on Vision4Press platform.
Data correspond to usage on the plateform after 2015. The current usage metrics is available 48-96 hours after online publication and is updated daily on week days.
Initial download of the metrics may take a while.