Fig. A.1
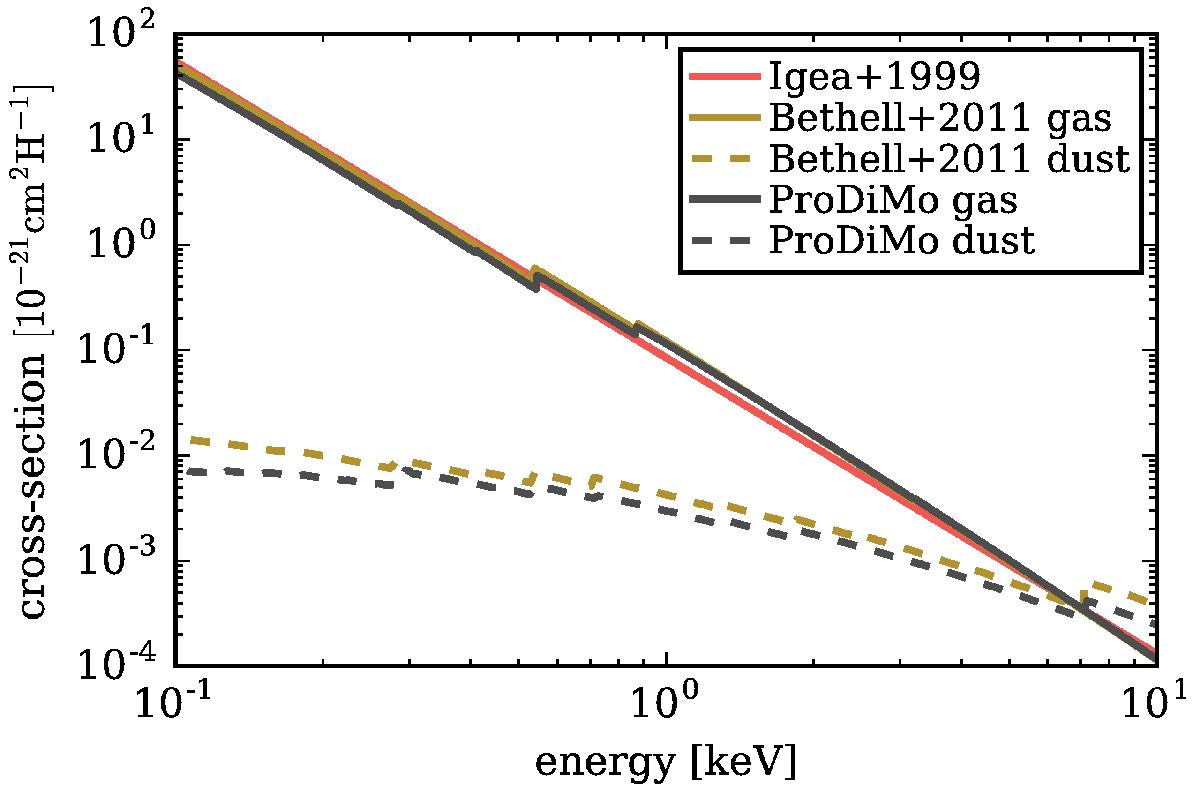
Comparison of X-ray photoelectric (absorption) cross-sections per hydrogen nucleus as a function of photon energy. The red line shows the gas absorption cross-section from Igea & Glassgold (1999). The brown lines show the cross-sections derived by Bethell & Bergin (2011). The black lines show the PRODIMO results for the large grains dust model.
Current usage metrics show cumulative count of Article Views (full-text article views including HTML views, PDF and ePub downloads, according to the available data) and Abstracts Views on Vision4Press platform.
Data correspond to usage on the plateform after 2015. The current usage metrics is available 48-96 hours after online publication and is updated daily on week days.
Initial download of the metrics may take a while.