Fig. 11
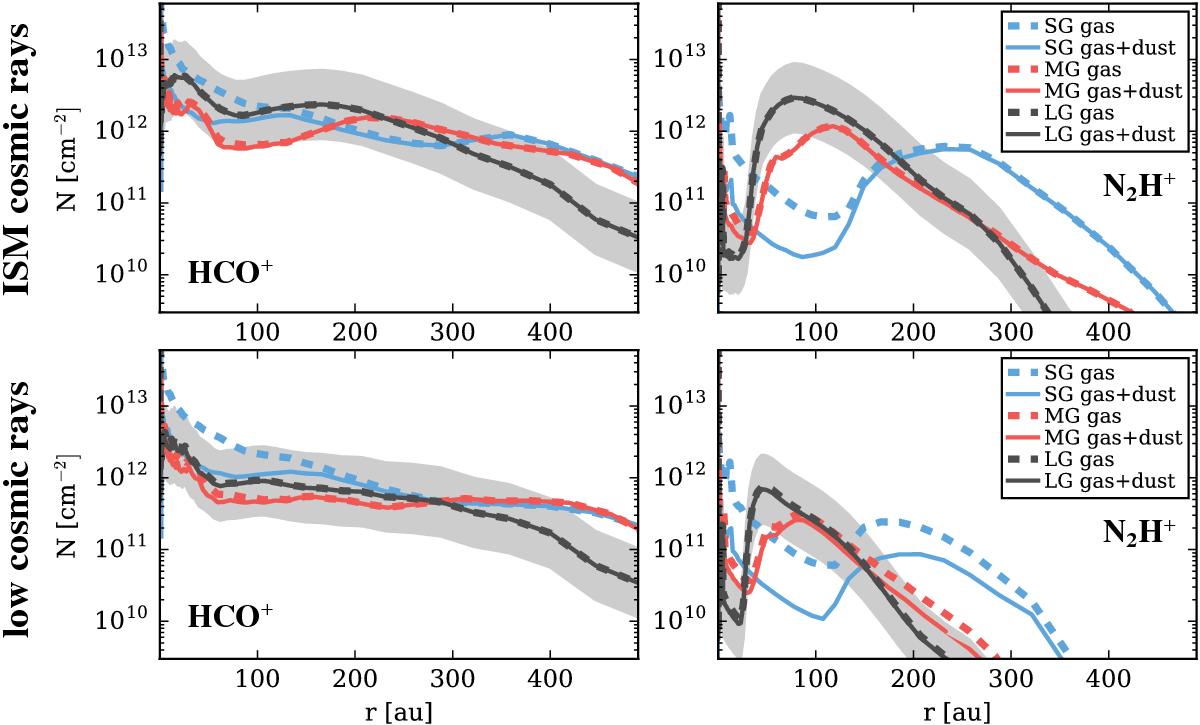
HCO+ (left column) and N2H+ (right column) radial column density profiles for models with different dust-size distributions: small grains (SG, blue), medium grains (MG, red), and large grains (LG, black). The dashed lines are for models where only the gas component is considered in the X-ray RT, where the solid lines show models where both X-ray gas and dust opacities are included. The ISM cosmic-ray models are shown in the top row and the low cosmic-ray models are shown in the bottom row. The grey shaded area marks a difference of a factor three in N with respect to the reference model (LG gas+dust).
Current usage metrics show cumulative count of Article Views (full-text article views including HTML views, PDF and ePub downloads, according to the available data) and Abstracts Views on Vision4Press platform.
Data correspond to usage on the plateform after 2015. The current usage metrics is available 48-96 hours after online publication and is updated daily on week days.
Initial download of the metrics may take a while.