Fig. 13
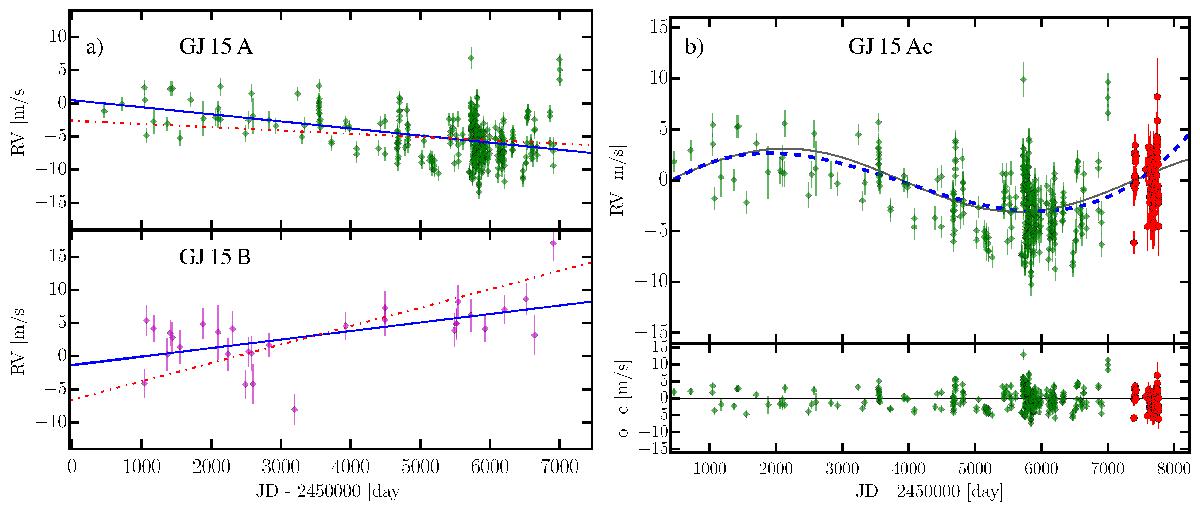
Panel a: from top to bottom, HIRES RV data for GJ 15 A and GJ 15 B modeled with a linear trend. Blue continuous lines represent the best linear trend model of the GJ 15 A and B datasets, while the red dot-dashed lines show the linear trend expected from the mass ratio of the two stars under the assumption that the other binary companion has the correct trend estimate. Panel b: time series RVs for GJ 15 A obtained with HIRES (green diamonds) and CARMENES (red circles). The fit to the data (black solid line) is a suggestive Keplerian model consistent with a long-period Saturn mass planet on a circular orbit. The dashed blue line represents a third order polynomial approximation to this orbit, which is needed for the statistical analysis (see text). The lower panel shows the residuals to the circular fit. A long-period planet yields a significant improvement over a simpler model fitting only a linear trend.
Current usage metrics show cumulative count of Article Views (full-text article views including HTML views, PDF and ePub downloads, according to the available data) and Abstracts Views on Vision4Press platform.
Data correspond to usage on the plateform after 2015. The current usage metrics is available 48-96 hours after online publication and is updated daily on week days.
Initial download of the metrics may take a while.