Fig. 11
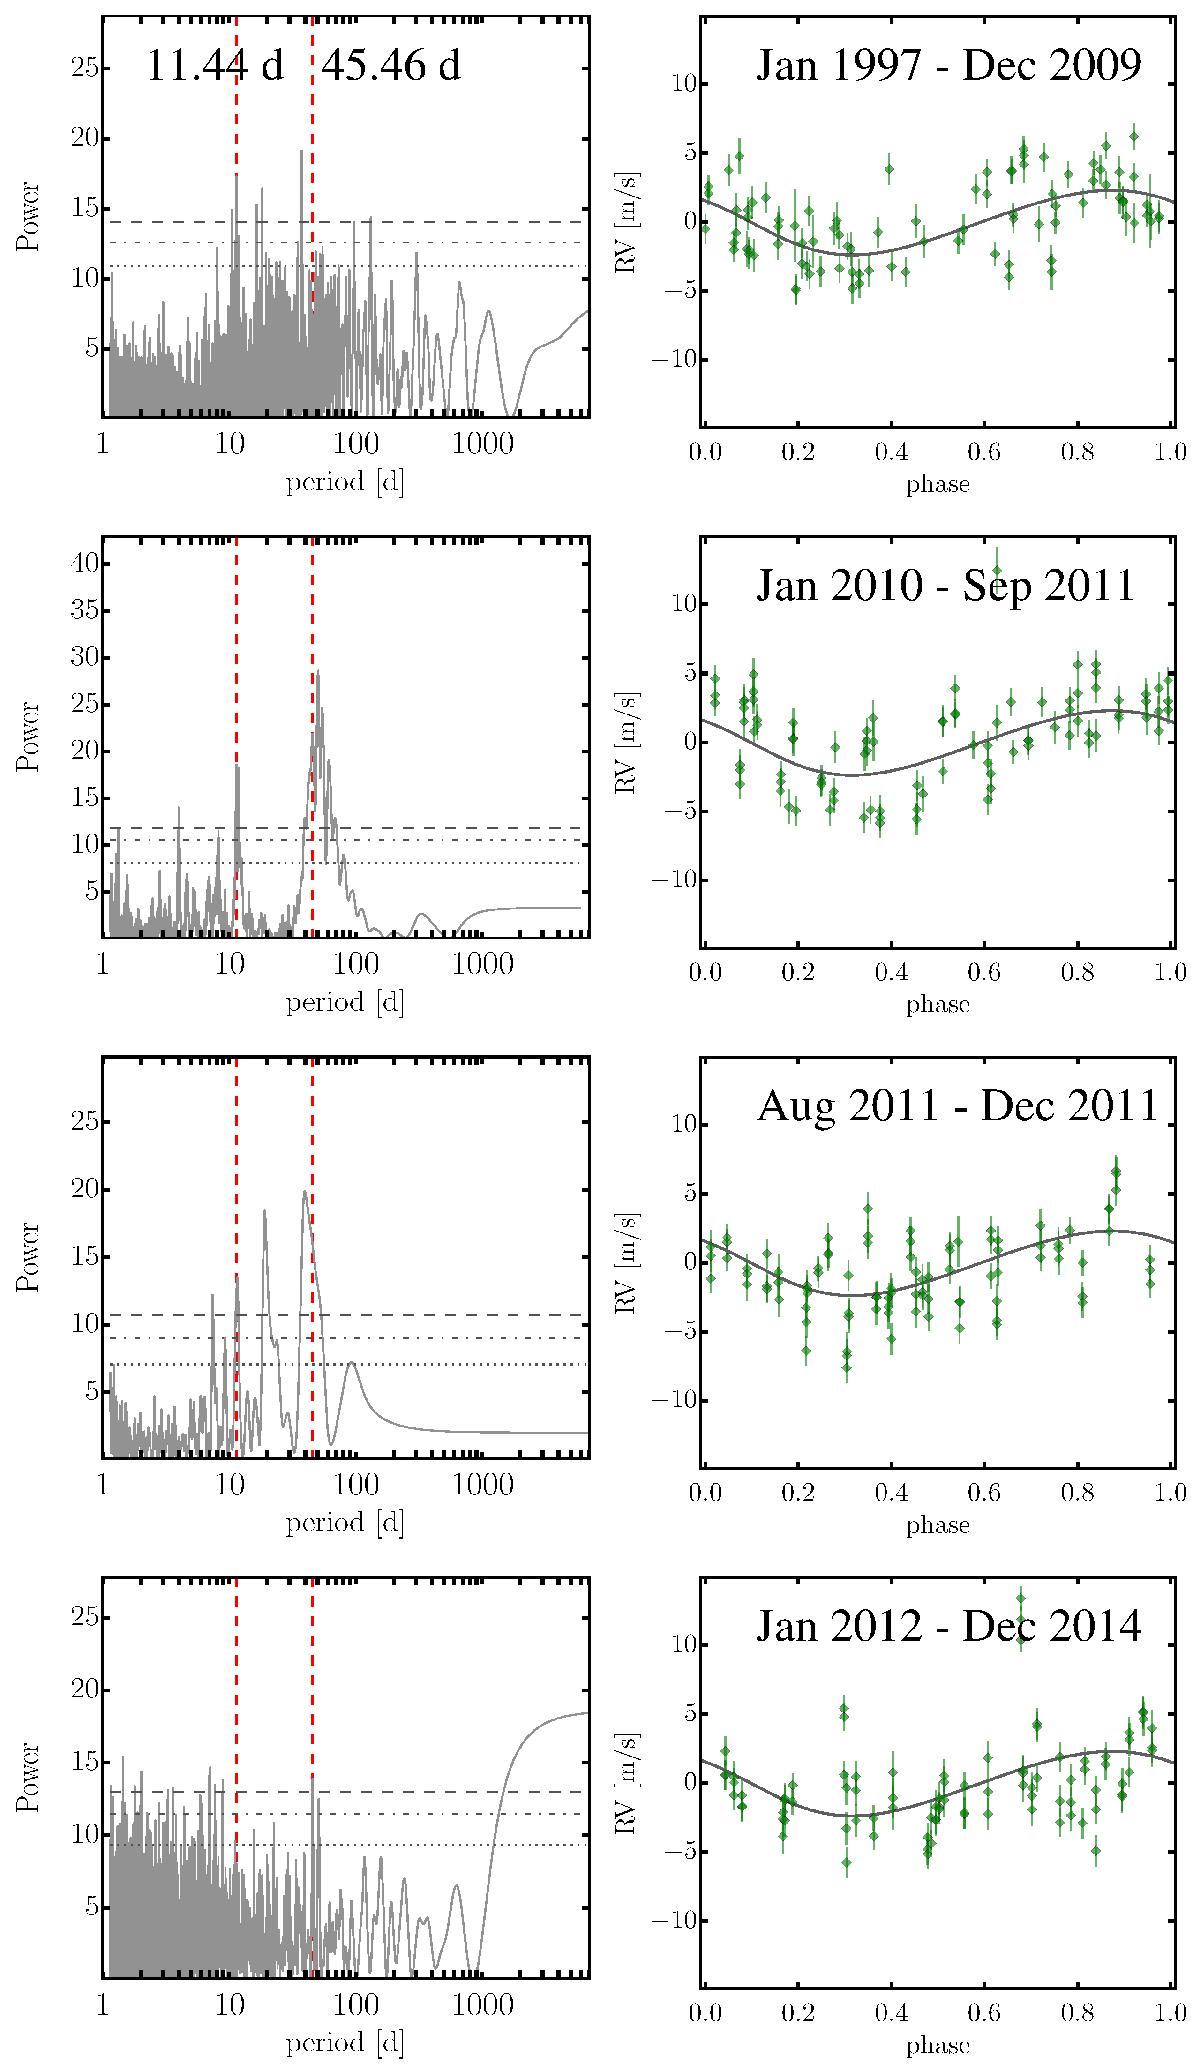
The 358 HIRES RVs for GJ 15 A, separated into four subsets of 90, 90, 90, and 88 RVs, respectively, and analyzed individually. The left panels show the GLS periodogram analysis for each of the four subsets, while the right panels show the RV data phase-folded to the best Keplerian fit + a linear trend calculated using the full set of HIRES data (see Fig. 10, panels a and b). The first 90 RVs are taken over a 10 yr period and are consistent with a 11.44 d, a ~40-day and other significant periodic signals. Between Jan. 2010 and Sep. 2011, GJ 15 A likely experienced a period of intensive activity leading to strong periodicity at ~45 d probably causing also the signal around 11.5 d. The same is true for the 90 RVs taken between Aug. 2011 and Dec. 2011, which show periodicities at ~40 d, 20 d, 11 d and 8 d. The last three years of HIRES data, however, are not consistent with signal at 11.44 d. As shown in Fig 10 panels c and d, at later epochs CARMENES is also not showing any periodic signal near 11 d.
Current usage metrics show cumulative count of Article Views (full-text article views including HTML views, PDF and ePub downloads, according to the available data) and Abstracts Views on Vision4Press platform.
Data correspond to usage on the plateform after 2015. The current usage metrics is available 48-96 hours after online publication and is updated daily on week days.
Initial download of the metrics may take a while.