Free Access
Fig. D.1
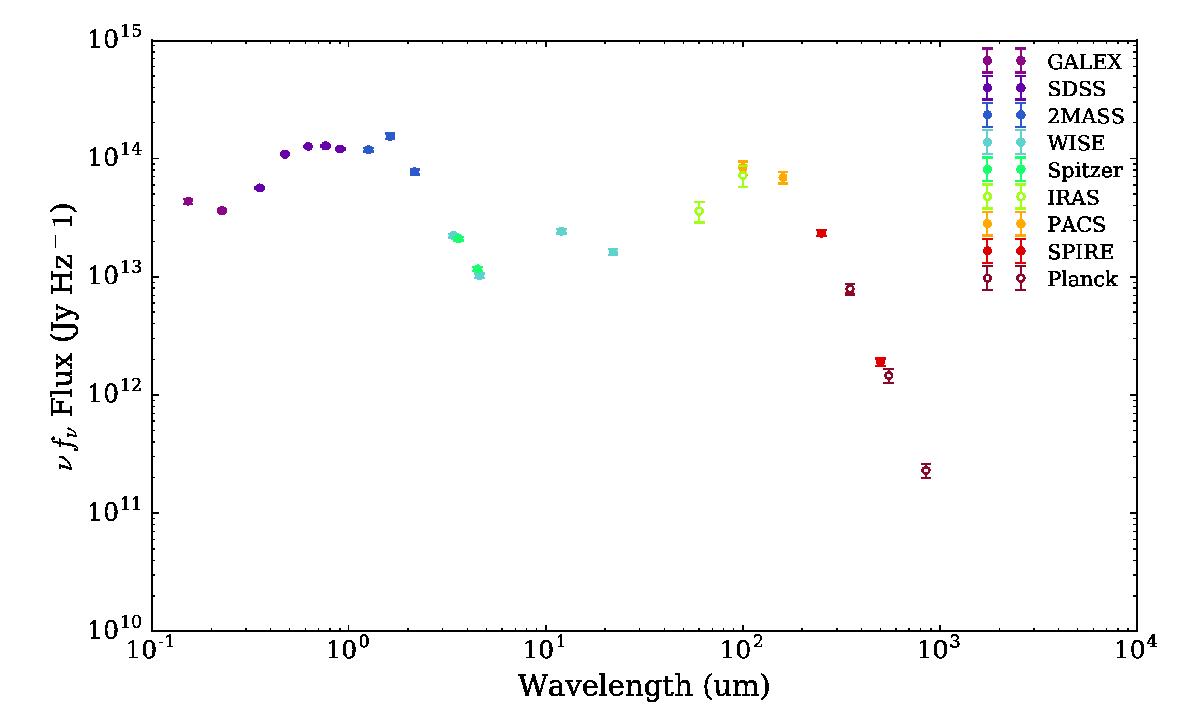
UV-mm SED of NGC 3631, showing an especially pronounced example of a “bump” in our 2MASS H-band photometry. 2MASS photometry is plotted in dark blue, with H-band hence being the central of the three 2MASS fluxes plotted (at 1.65 μm).
Current usage metrics show cumulative count of Article Views (full-text article views including HTML views, PDF and ePub downloads, according to the available data) and Abstracts Views on Vision4Press platform.
Data correspond to usage on the plateform after 2015. The current usage metrics is available 48-96 hours after online publication and is updated daily on week days.
Initial download of the metrics may take a while.