Fig. 1
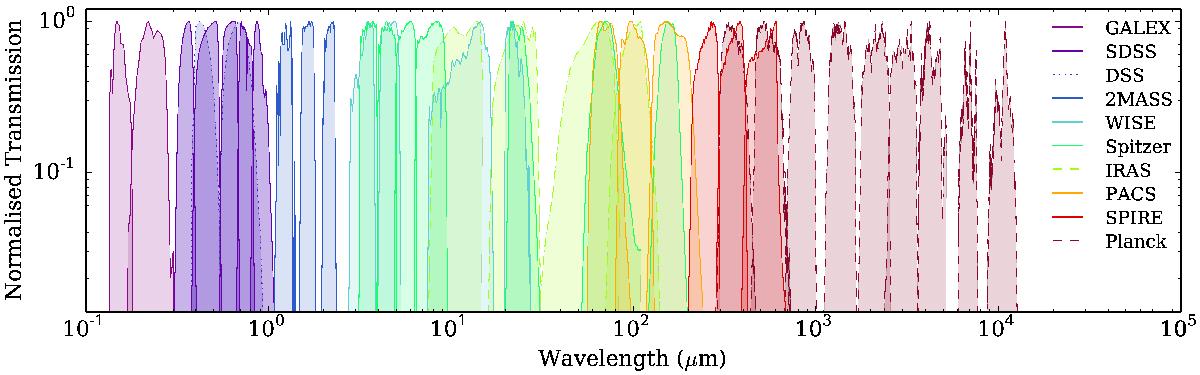
Illustration of the spectral coverage provided by the DustPedia database, showing filter response functions of all bands for which we present data. As can be seen, the data we employ effectively provides complete sampling of over five orders of magnitude in wavelength. Response functions of the bands for which we present both imagery and aperture-matched photometry are traced with solid lines. Bands for which we present supplementary external photometry (see Sect. 5) are traced with dashed lines. Bands for which we present imagery only (see Sect. 2.2.3) are traced with dotted lines.
Current usage metrics show cumulative count of Article Views (full-text article views including HTML views, PDF and ePub downloads, according to the available data) and Abstracts Views on Vision4Press platform.
Data correspond to usage on the plateform after 2015. The current usage metrics is available 48-96 hours after online publication and is updated daily on week days.
Initial download of the metrics may take a while.