Fig. 3
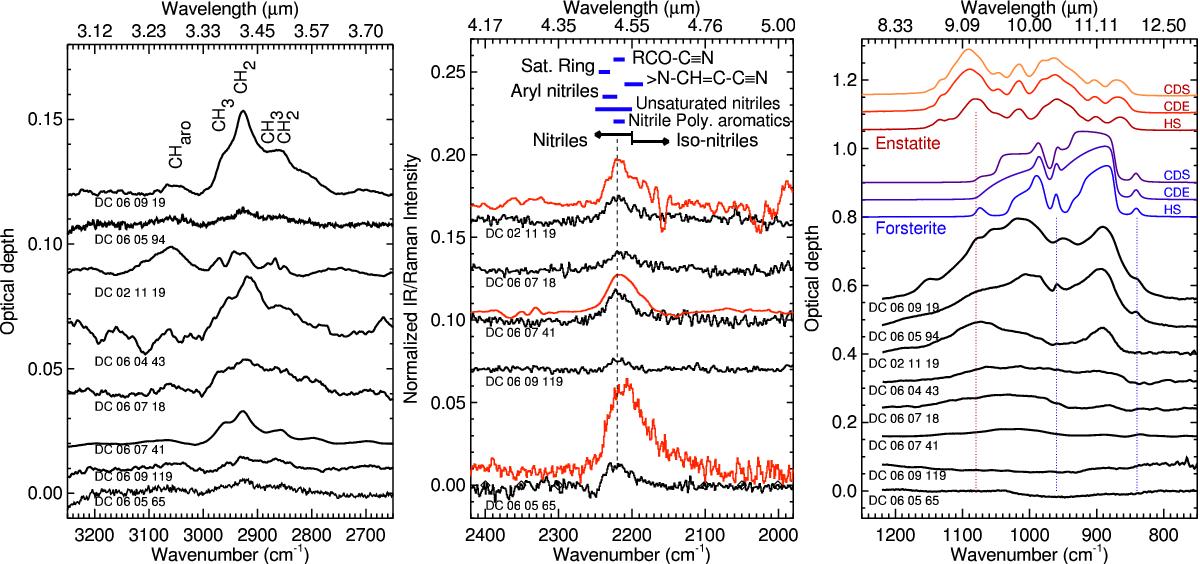
Measured UCAMMs spectra. Left: CH stretching mode infrared optical depth. Centre panel: μFTIR (red) and Raman (black) close-up spectra in the nitriles region, normalized to the C=C (IR) and G band (Raman) measured intensities. Right: baseline corrected silicate infrared optical depth, along with different absorption models for several size distributions of olivine (forsterite) and pyroxene (enstatite) magnesium rich end members (see text for details).
Current usage metrics show cumulative count of Article Views (full-text article views including HTML views, PDF and ePub downloads, according to the available data) and Abstracts Views on Vision4Press platform.
Data correspond to usage on the plateform after 2015. The current usage metrics is available 48-96 hours after online publication and is updated daily on week days.
Initial download of the metrics may take a while.