Free Access
Fig. 6
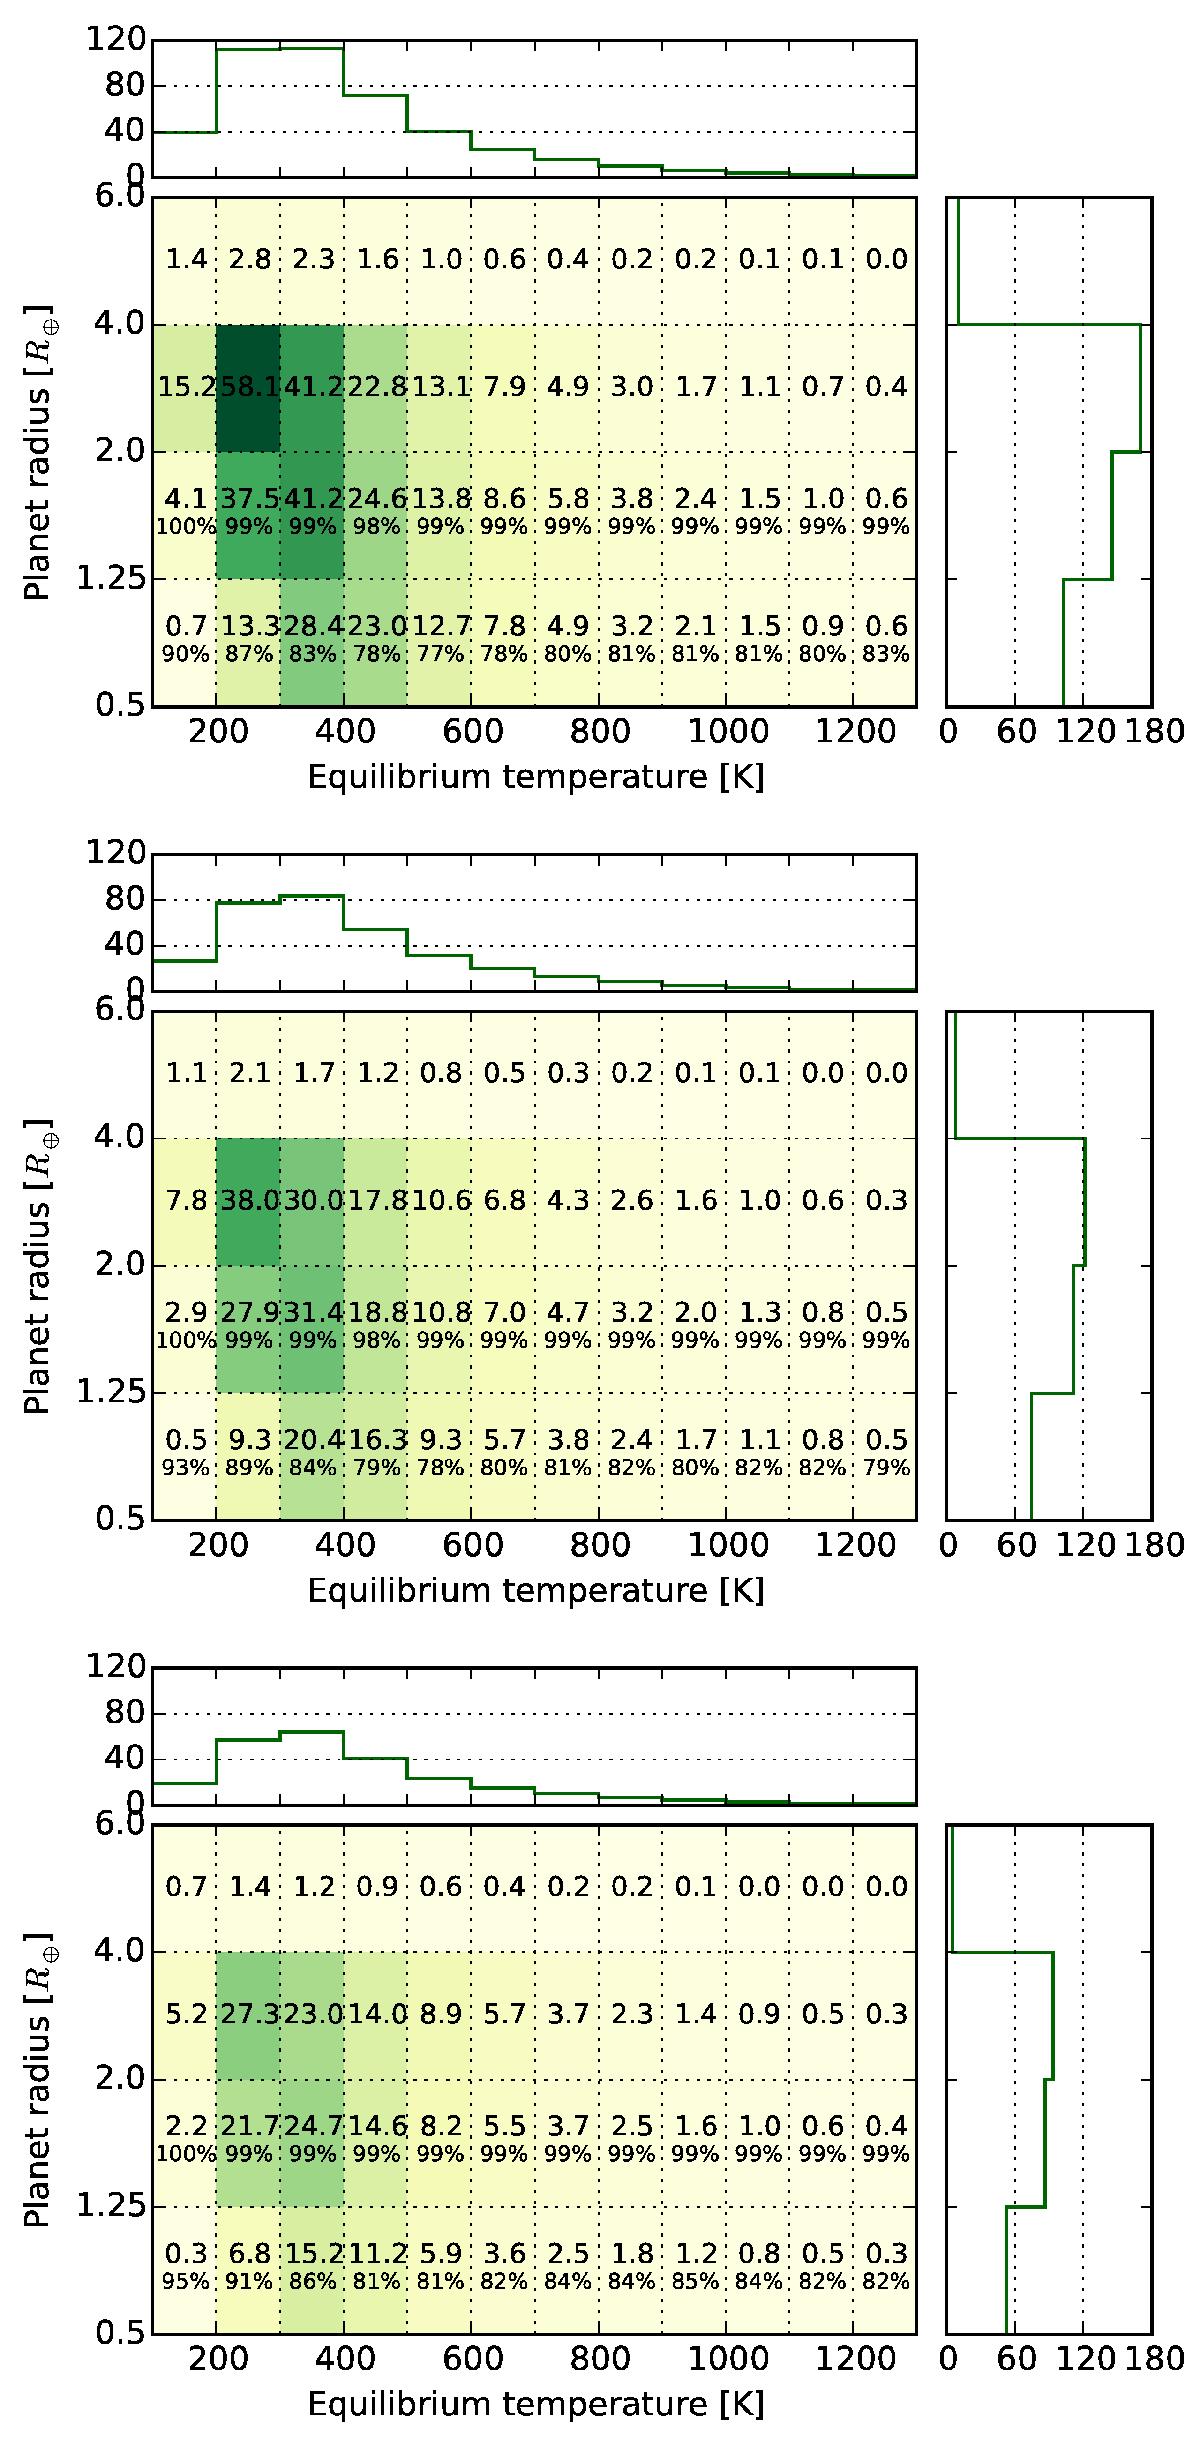
Expected number of detectable exoplanets combined for all three simulated filters for our best-case scenario (top; r + Δr), for our baseline scenario (middle), and for our worst-case scenario (bottom; r−Δr), binned in the radius-equilibrium temperature plane (like in Fig. 2).
This figure is made of several images, please see below:
Current usage metrics show cumulative count of Article Views (full-text article views including HTML views, PDF and ePub downloads, according to the available data) and Abstracts Views on Vision4Press platform.
Data correspond to usage on the plateform after 2015. The current usage metrics is available 48-96 hours after online publication and is updated daily on week days.
Initial download of the metrics may take a while.