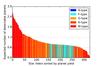
Fig. 4
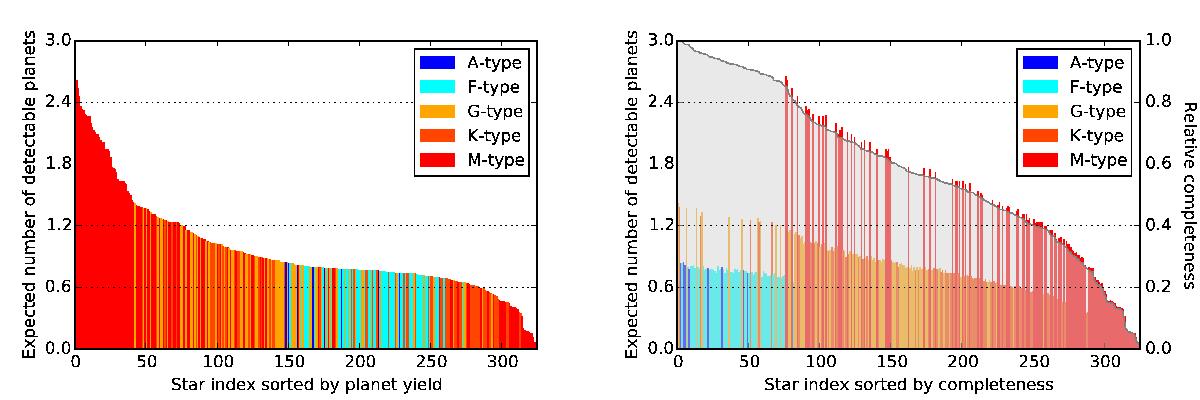
Left: expected number of detectable exoplanets (with radii <6 REarth) for each individual host star from our star catalog. Each of the 326 host stars is represented by one bin of the histogram (see color code for the different spectral types in the figure legend). This plot contains all exoplanets that can be detected in at least one of the three filters used in this work (5.6 μm, 10 μm, 15 μm). Right: expected number of detectable exoplanets for each individual host star from our star catalog (left axis, as in the left panel), but sorted by completeness (right axis) overplotted as the transparent gray curve on the histogram.
Current usage metrics show cumulative count of Article Views (full-text article views including HTML views, PDF and ePub downloads, according to the available data) and Abstracts Views on Vision4Press platform.
Data correspond to usage on the plateform after 2015. The current usage metrics is available 48-96 hours after online publication and is updated daily on week days.
Initial download of the metrics may take a while.