Fig. 3
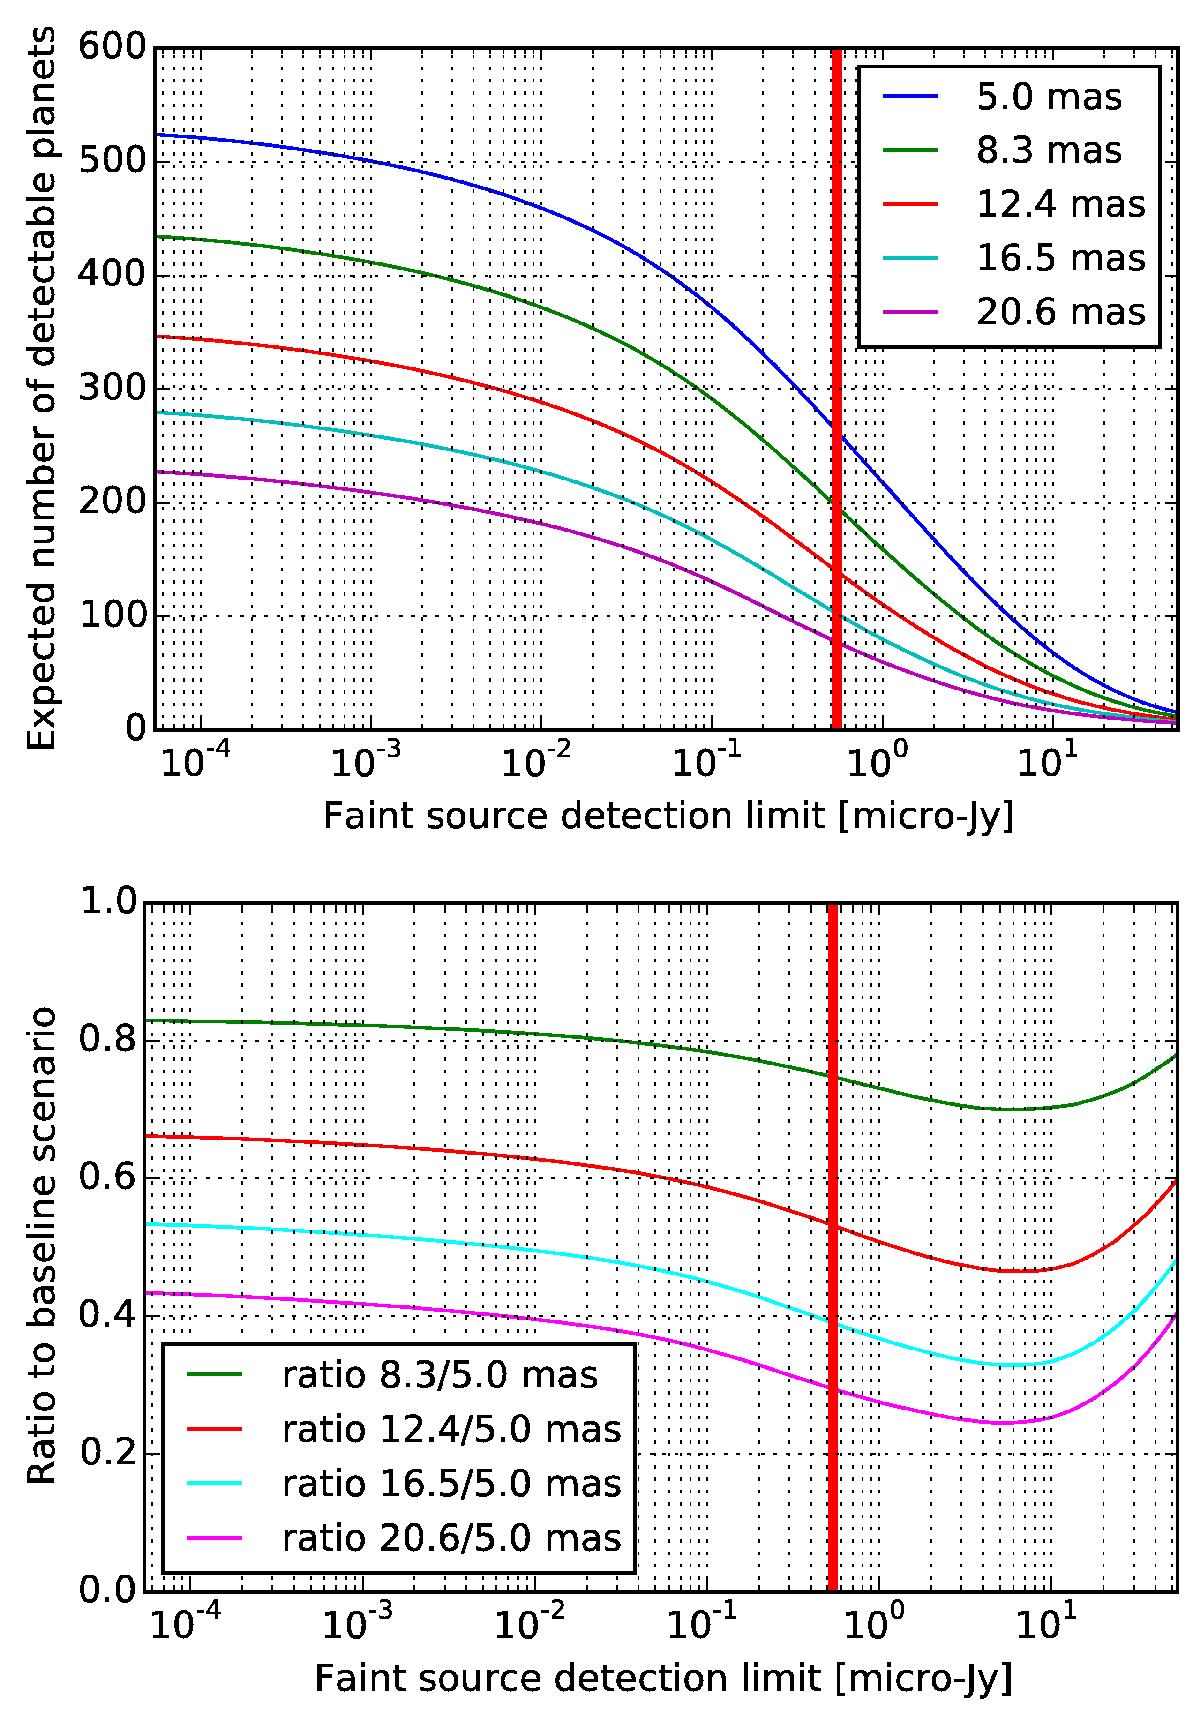
Top: expected number of detectable exoplanets (with radii < 6 REarth) as a function of the faint source detection limit Flim for the 10 μm filter. The five curves represent various nulling baselines, i.e., various IWAs ranging from 5.0 mas (baseline value) to 20.6 mas. The red vertical line indicates our baseline detection limit of Flim, F1000W = 0.54 μJy. Bottom: ratios of the other curves to the 5.0 mas curve as a function of the faint source detection limit Flim.
Current usage metrics show cumulative count of Article Views (full-text article views including HTML views, PDF and ePub downloads, according to the available data) and Abstracts Views on Vision4Press platform.
Data correspond to usage on the plateform after 2015. The current usage metrics is available 48-96 hours after online publication and is updated daily on week days.
Initial download of the metrics may take a while.