Fig. 2
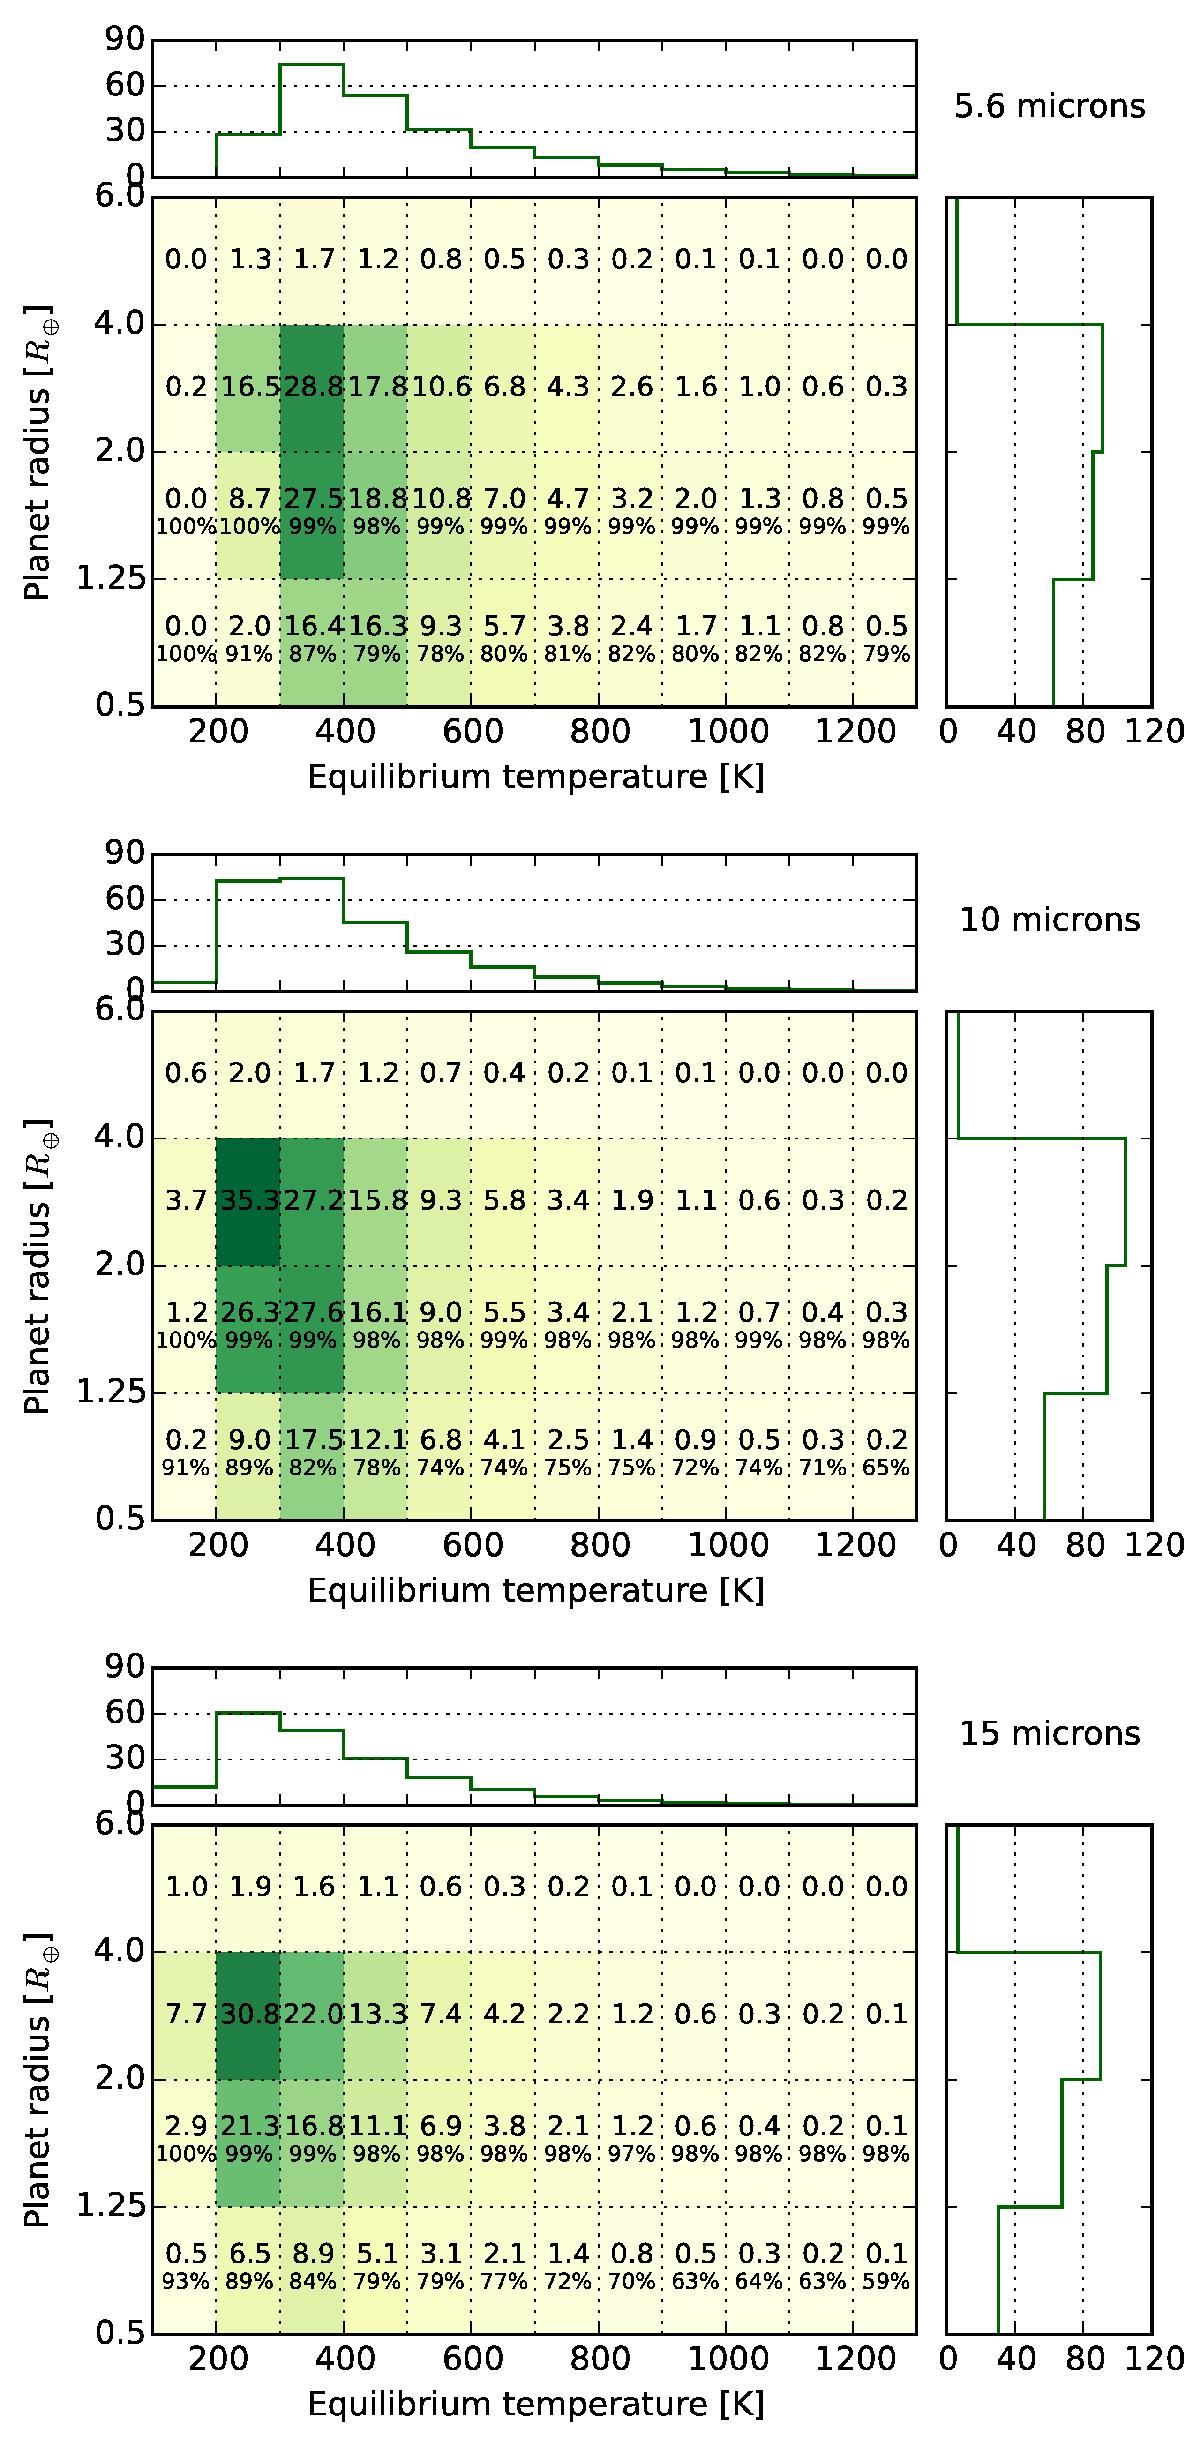
Expected number of detectable exoplanets binned in the radius-equilibrium temperature plane for the 5.6 μm filter (F560W, top), 10 μm filter (F1000W, middle), and 15 μm filter (F1500W, bottom). The histograms in each subfigure show the projected equilibrium temperature distribution (top) and the projected radius distribution (right) of the detectable exoplanets. The numbers in percent state the percentage of planets, which is also detectable with radial velocity observations assuming a detection threshold of K∗ ≥ 10 cm s-1 and a planet density of ρp = 5000 kg m-3. Color shade and figure axes are scaled equally in all three subfigures for better comparison. A negligible percentage of detectable exoplanets (![]() 1%) have equilibrium temperatures below 100 K or above 1300 K and thus lie outside the depicted bins.
1%) have equilibrium temperatures below 100 K or above 1300 K and thus lie outside the depicted bins.
Current usage metrics show cumulative count of Article Views (full-text article views including HTML views, PDF and ePub downloads, according to the available data) and Abstracts Views on Vision4Press platform.
Data correspond to usage on the plateform after 2015. The current usage metrics is available 48-96 hours after online publication and is updated daily on week days.
Initial download of the metrics may take a while.