Free Access
Fig. 6
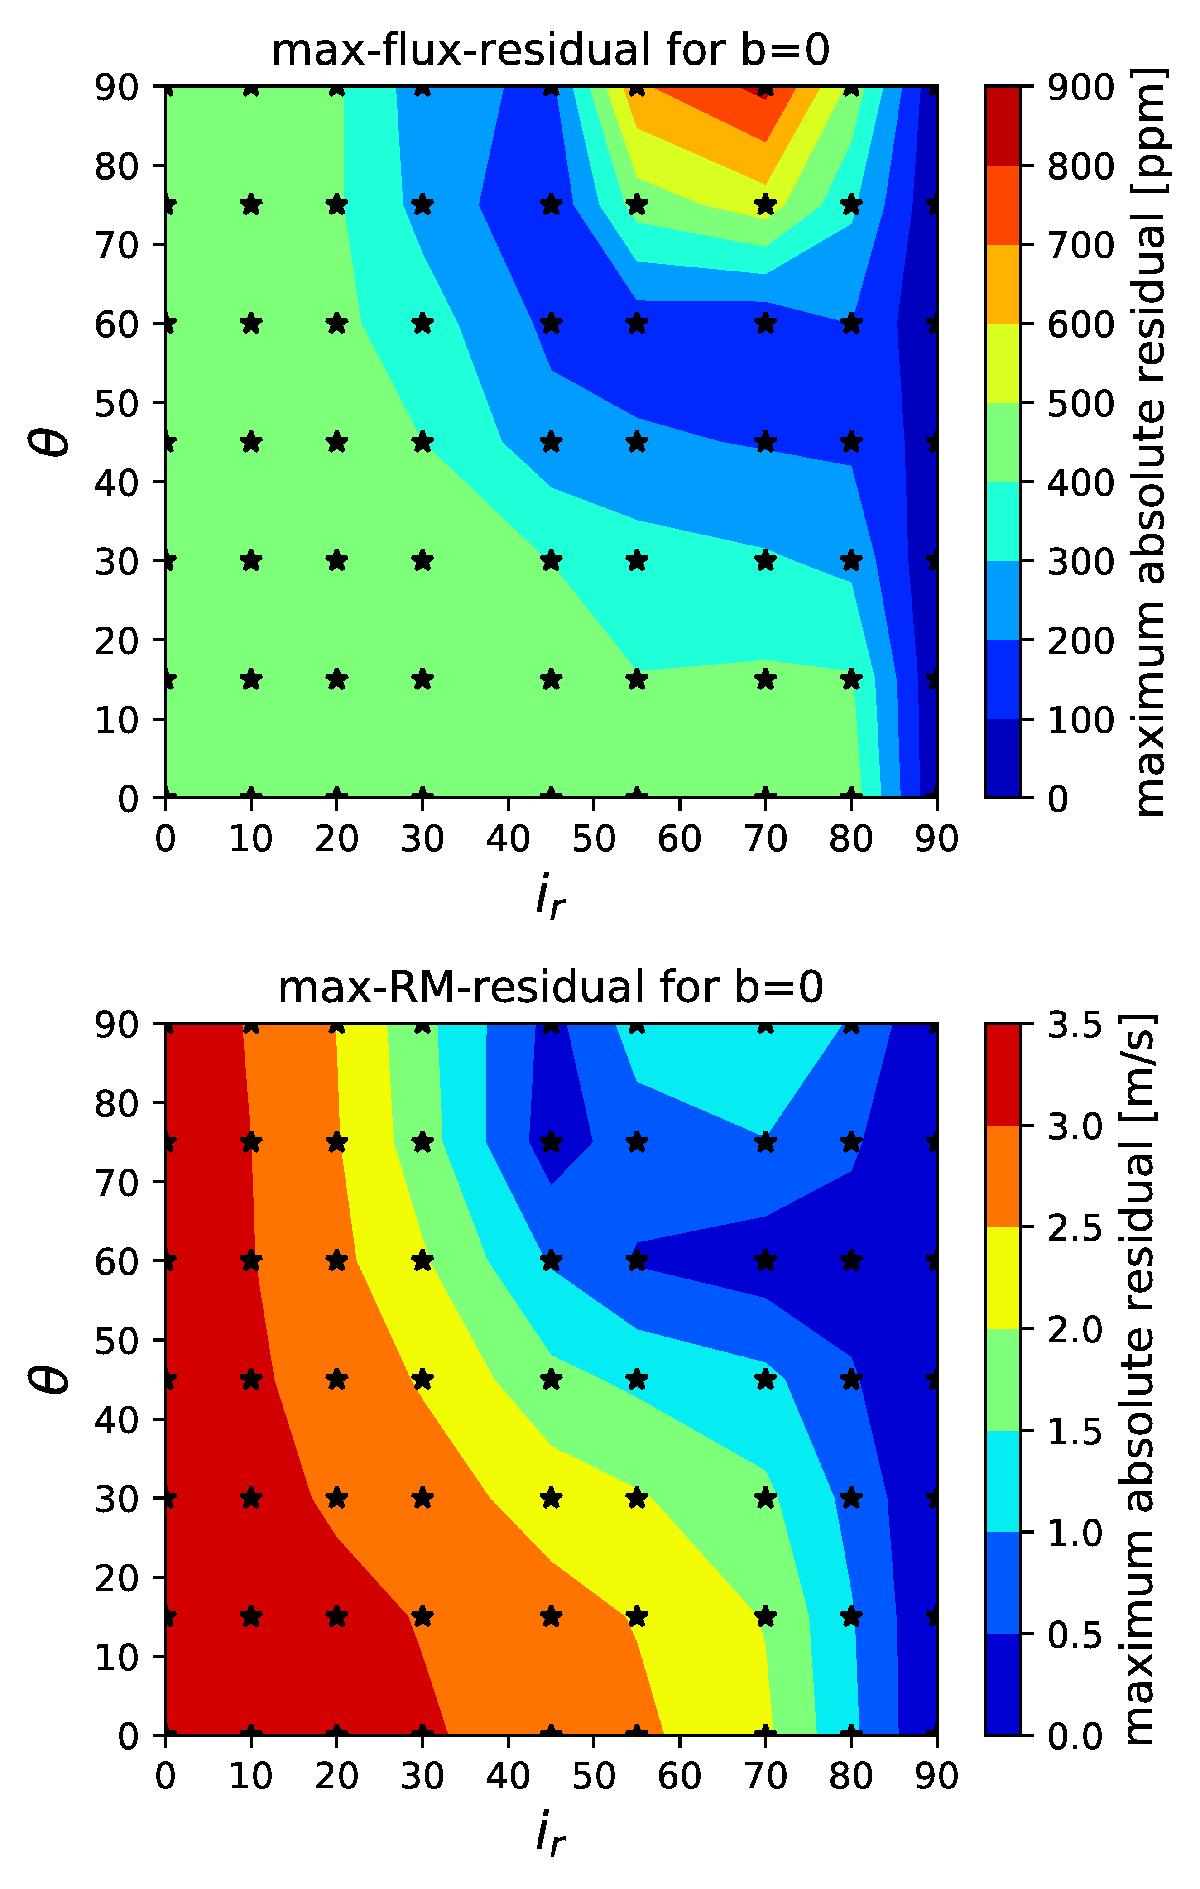
Contour plot from maximum absolute residual obtained from fit of 63 ring orientations. Top plot: contour plot for the light-curve fit while bottom plot: contour plot for the RM fit.
Current usage metrics show cumulative count of Article Views (full-text article views including HTML views, PDF and ePub downloads, according to the available data) and Abstracts Views on Vision4Press platform.
Data correspond to usage on the plateform after 2015. The current usage metrics is available 48-96 hours after online publication and is updated daily on week days.
Initial download of the metrics may take a while.