Free Access
Fig. 14
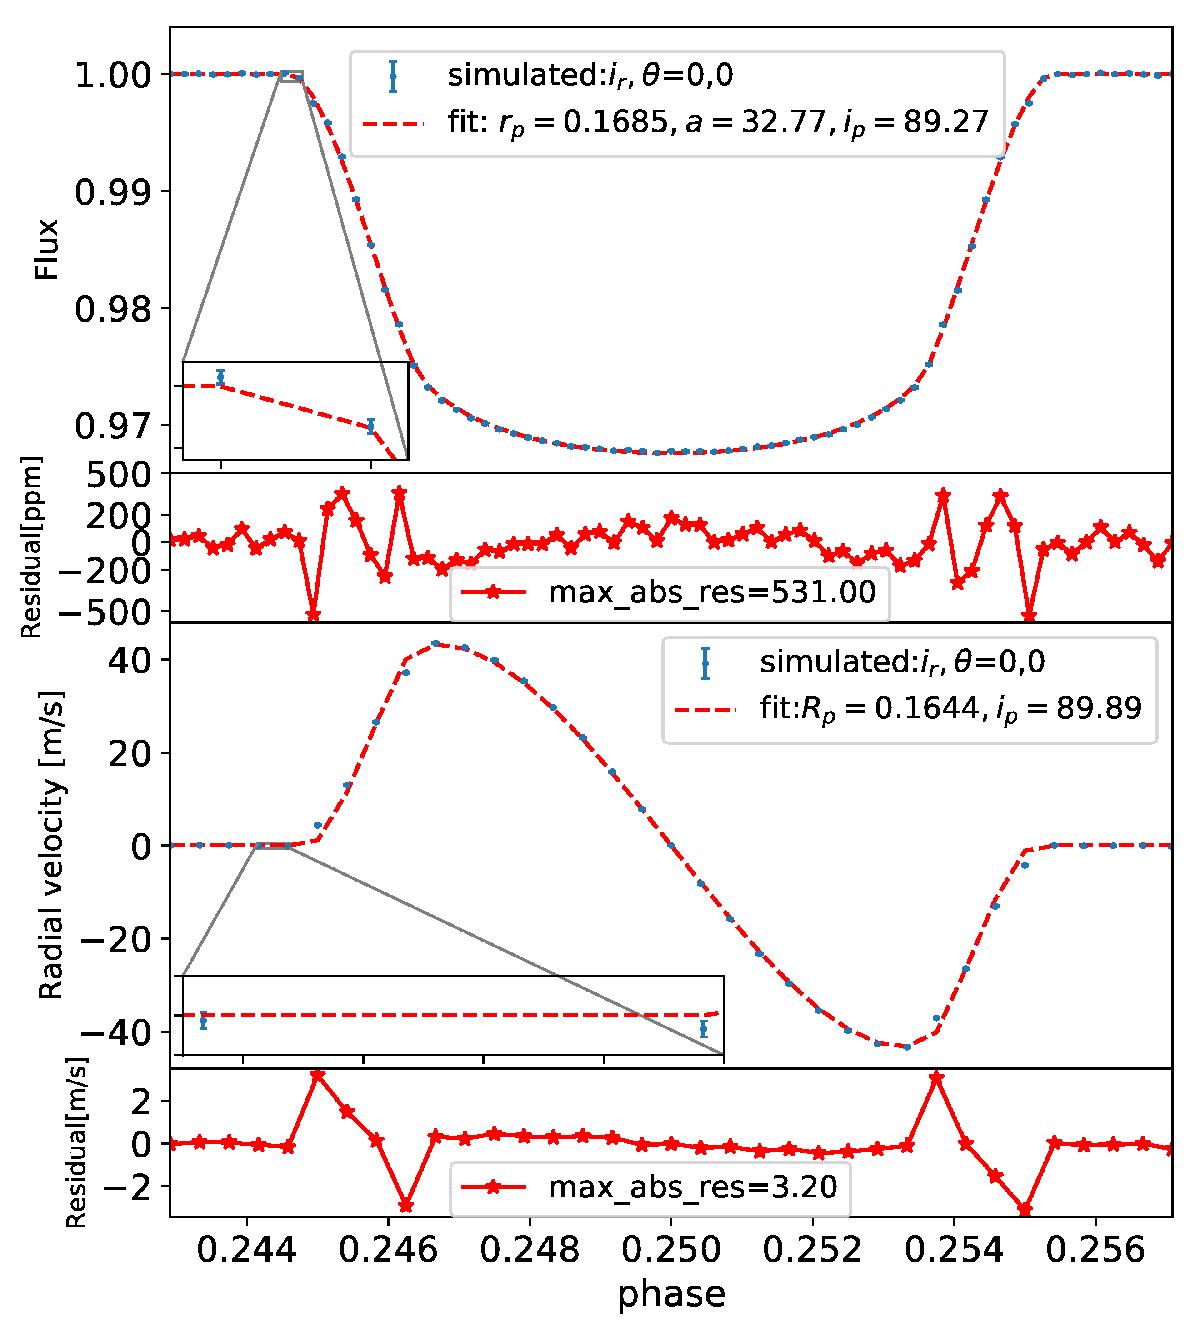
Top panel: fit of simulated light curve with CHEOPS noise level of 56 ppm for time-sampling of 7 min. Bottom panel: fit of simulated RM signal with noise at ESPRESSO level of 0.1 m/s and 15 min time-sampling. Insets show the zoom of the error bars.
Current usage metrics show cumulative count of Article Views (full-text article views including HTML views, PDF and ePub downloads, according to the available data) and Abstracts Views on Vision4Press platform.
Data correspond to usage on the plateform after 2015. The current usage metrics is available 48-96 hours after online publication and is updated daily on week days.
Initial download of the metrics may take a while.