Fig. 17
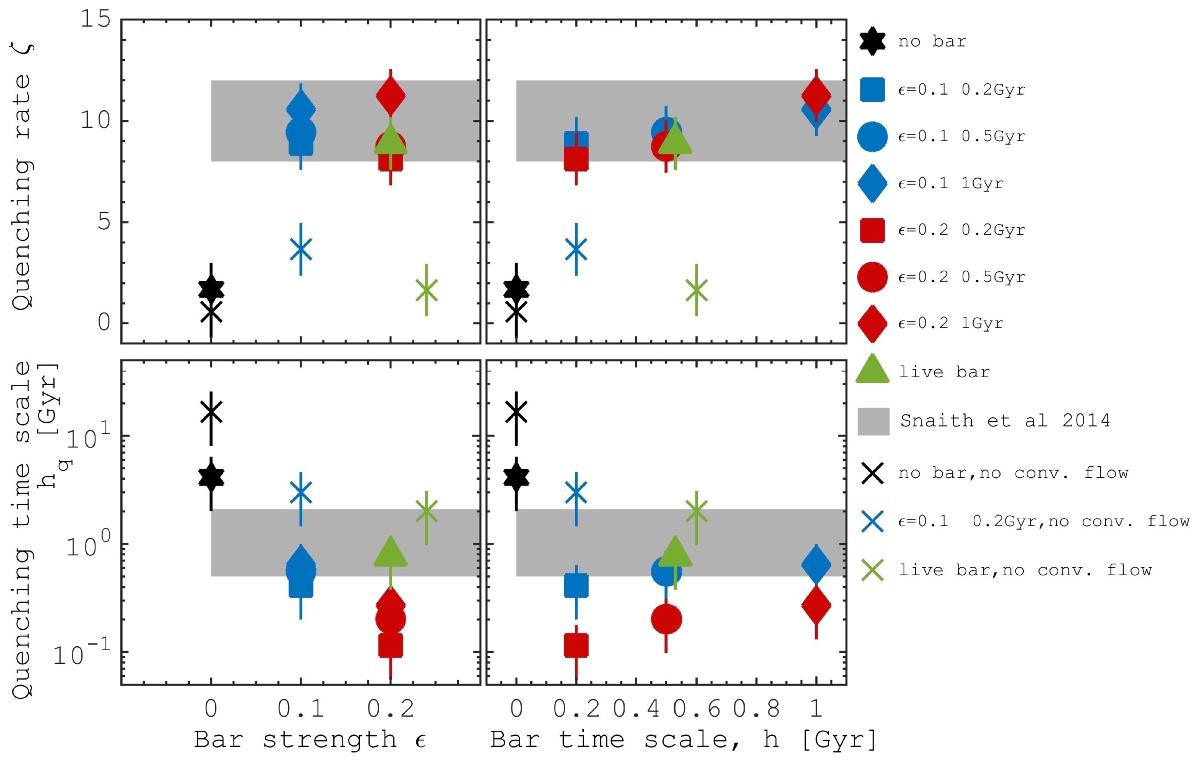
Relation between the quenching rate, ζ, and quenching timescale, hq, and bar parameters, bar strength ε and bar timescale h, in our simulated galaxies. Black 6-pointed star formally shows the parameters measured for a model without a bar. The blue symbols show the results for models with a bar strength ε = 0.1, while the red symbols indicate models with ε = 0.2 with a rigid bar potential. Green triangle corresponds to the results of the self-consistent bar simulation. The filled gray area in each panel represents the quenching parameters measured for SFH of the inner Milky Way (Snaith et al. 2014). We note that the symbol colors are the same as in SFHs used in Figs. 14 and 15. Models without taking into account converging flow criteria in the star-formation prescription are shows by crosses. Error bars refer to the 95% confidence interval from the fitting procedure.
Current usage metrics show cumulative count of Article Views (full-text article views including HTML views, PDF and ePub downloads, according to the available data) and Abstracts Views on Vision4Press platform.
Data correspond to usage on the plateform after 2015. The current usage metrics is available 48-96 hours after online publication and is updated daily on week days.
Initial download of the metrics may take a while.