Free Access
Fig. 15
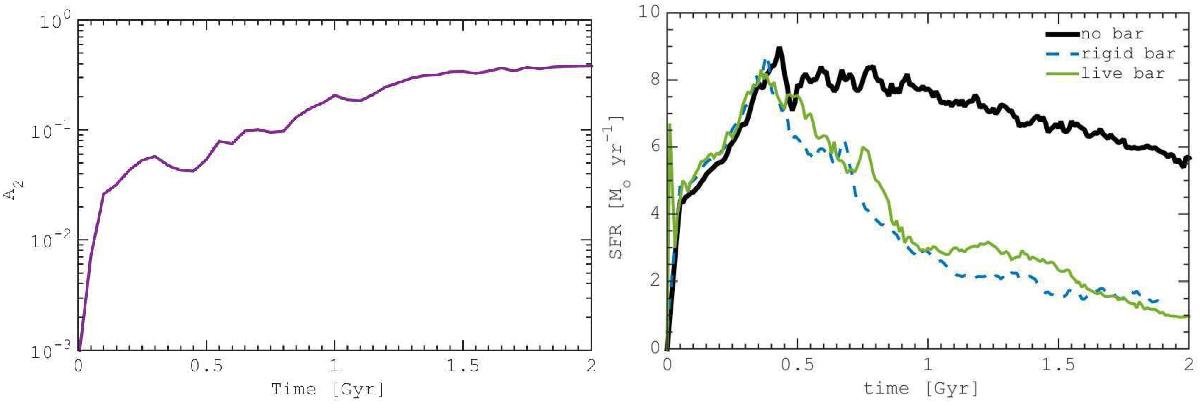
Left: bar strength defined as the amplitude of the m = 2 Fourier moment, A2, as a function of time in the self-consistent model. Right: SFH in the live bar simulation (green solid line) and in the rigid bar simulation (dashed blue line, model RBe02). The black line represents the SFR in model with no bar.
This figure is made of several images, please see below:
Current usage metrics show cumulative count of Article Views (full-text article views including HTML views, PDF and ePub downloads, according to the available data) and Abstracts Views on Vision4Press platform.
Data correspond to usage on the plateform after 2015. The current usage metrics is available 48-96 hours after online publication and is updated daily on week days.
Initial download of the metrics may take a while.