Fig. 10
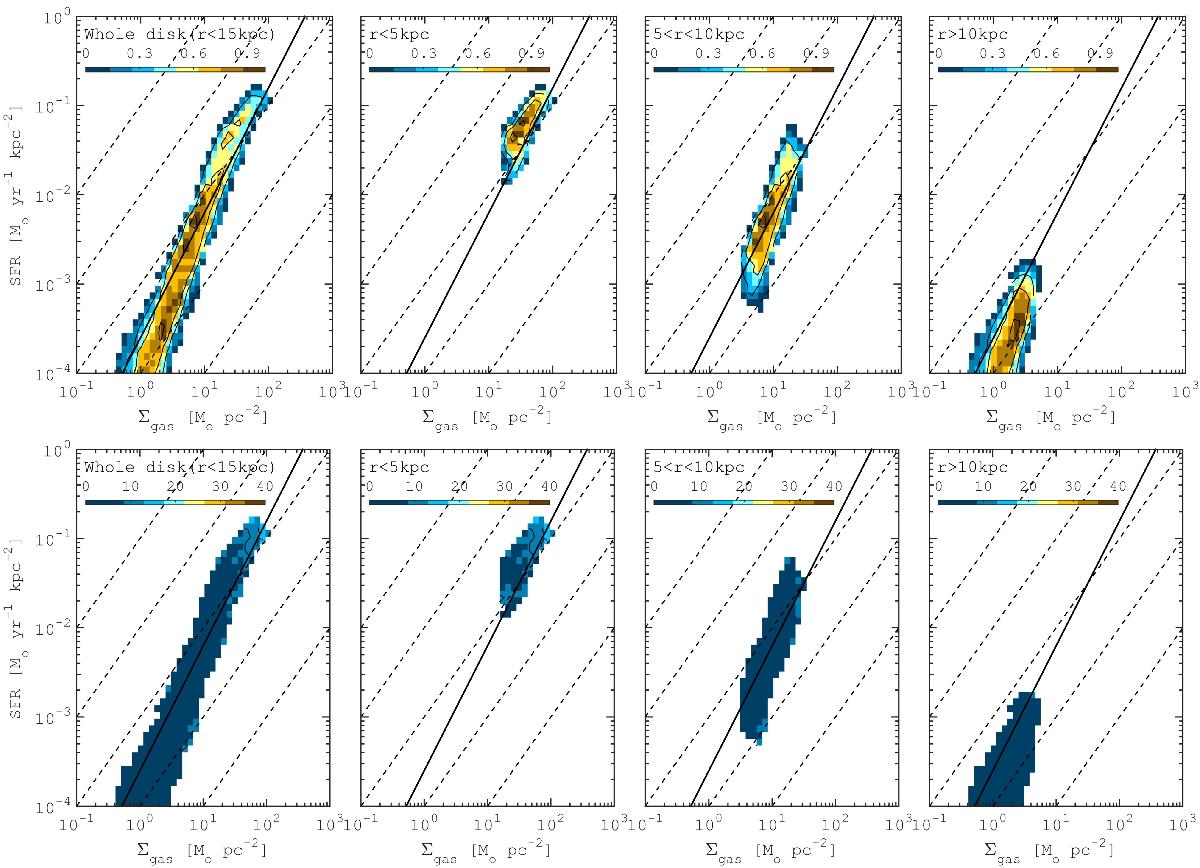
Relationship between the SFR surface density and the gas surface density, ΣSFR−Σgas, in the model without bar (RA) at a single time, 1.2 Gyr for a variety of spatial scales over the disk. In the top row color represents normalised density (from 0 to 1) with a given SFR and gas density; in bottom row color represents a mean gas velocity dispersion and contours show the values from 10 km s-1 to 40 km s-1 with a bin size of 5 km s-1 . Panels from left to right: the K-S relationship using data from the entire disk; from the inner, r< 5 kpc; from the radii between 5 <r< 10 kpc; and from the outer parts of the disk, r> 10 kpc. The solid black line represents the K-S relation with a slope of 1.4 (Kennicutt 1998). The diagonal dashed lines cutting across each panel represents the star-formation efficiencies of 100%, 10%, 1%, 0.1% and 0.01% per 109 yr.
Current usage metrics show cumulative count of Article Views (full-text article views including HTML views, PDF and ePub downloads, according to the available data) and Abstracts Views on Vision4Press platform.
Data correspond to usage on the plateform after 2015. The current usage metrics is available 48-96 hours after online publication and is updated daily on week days.
Initial download of the metrics may take a while.