Fig. 9
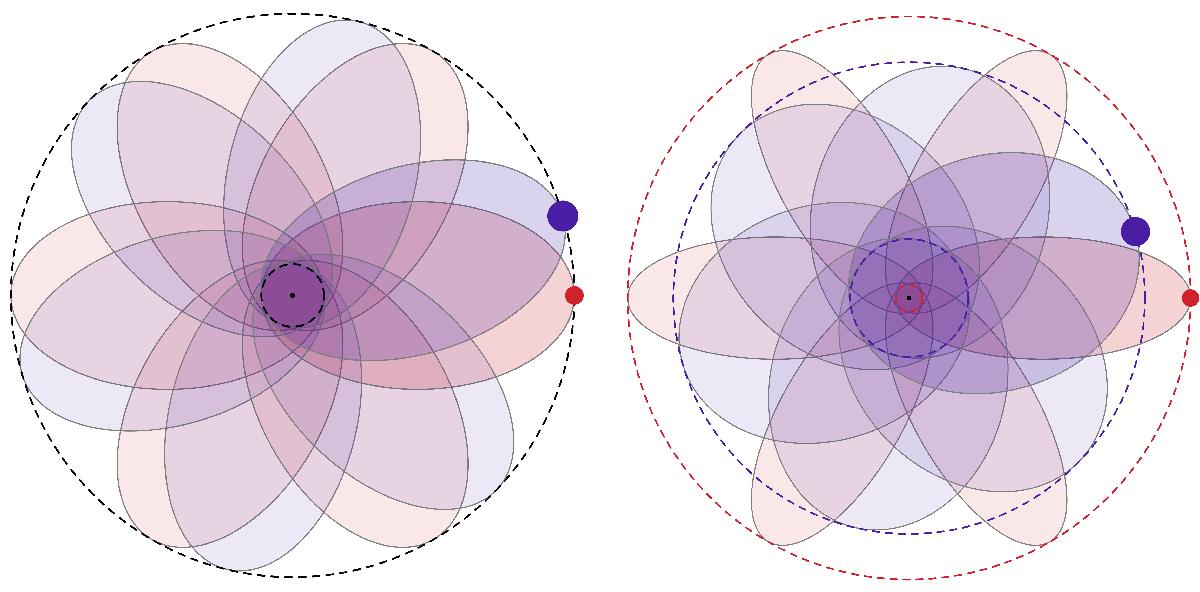
Illustration in configuration space of the mass segregation of the two different components obtained in Fig. 8. Here, the population of red orbits has a lighter individual mass than the blue population. Left panel: illustration of the initial orbits of the wires, where the blue and red wires have the same semi-major axis and eccentricity. Right panel: illustration of the wires’ orbits after the resonant mass segregation. During the resonant relaxation, the wires conserve their semi-major axis, but, following Fig. 8, the light red wires get larger eccentricities, while the heavy blue wires diffuse towards smaller eccentricities and circularise. Because of this segregation, one can note that red orbits get closer to the central BH, as illustrated by the dashed circles.
Current usage metrics show cumulative count of Article Views (full-text article views including HTML views, PDF and ePub downloads, according to the available data) and Abstracts Views on Vision4Press platform.
Data correspond to usage on the plateform after 2015. The current usage metrics is available 48-96 hours after online publication and is updated daily on week days.
Initial download of the metrics may take a while.