Fig. 8
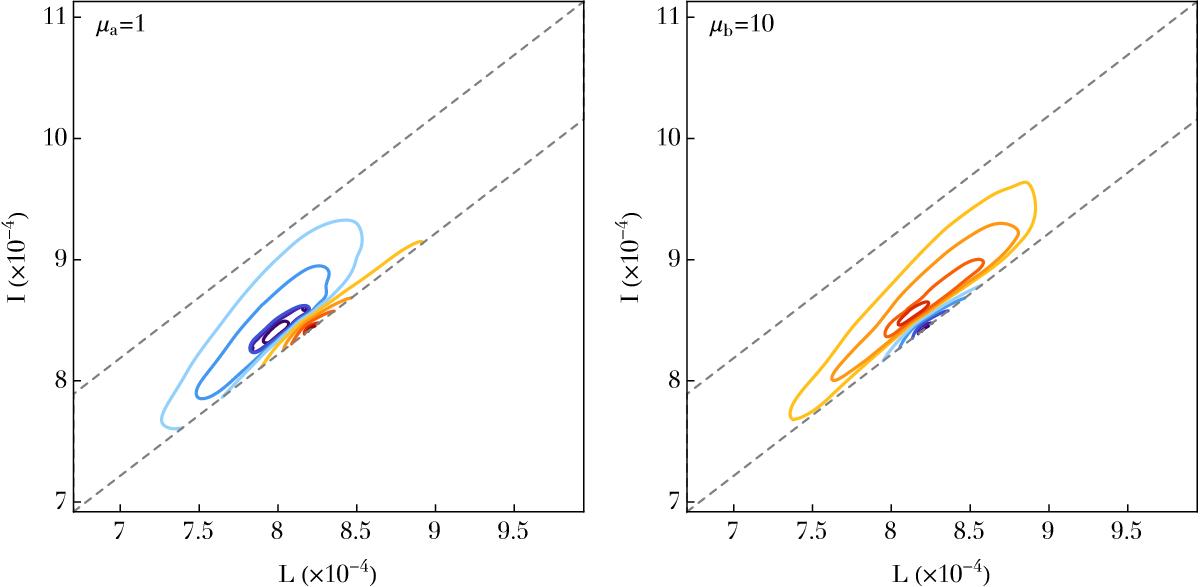
Divergence of the diffusion flux, div(ℱtot), predicted by the multi-component Landau Eq. (47)and following the conventions from Fig. 6. Left panel: for the population “a” of light wires of individual mass μa = 1. The maximum value for the positive blue contours is given by ![]() , while the minimum value for the negative red contours reads
, while the minimum value for the negative red contours reads ![]() . Right panel: for the population “b” of heavy wires of individual mass μb = 10. The maximum and minimum values for the contours are given by
. Right panel: for the population “b” of heavy wires of individual mass μb = 10. The maximum and minimum values for the contours are given by ![]() and
and ![]() . Wires are initially distributed according to similar DFs, but undergo a mass segregation on secular timescales. Light wires get larger eccentricity (smaller L), while heavy wires circularise (larger L).
. Wires are initially distributed according to similar DFs, but undergo a mass segregation on secular timescales. Light wires get larger eccentricity (smaller L), while heavy wires circularise (larger L).
Current usage metrics show cumulative count of Article Views (full-text article views including HTML views, PDF and ePub downloads, according to the available data) and Abstracts Views on Vision4Press platform.
Data correspond to usage on the plateform after 2015. The current usage metrics is available 48-96 hours after online publication and is updated daily on week days.
Initial download of the metrics may take a while.