Fig. 6
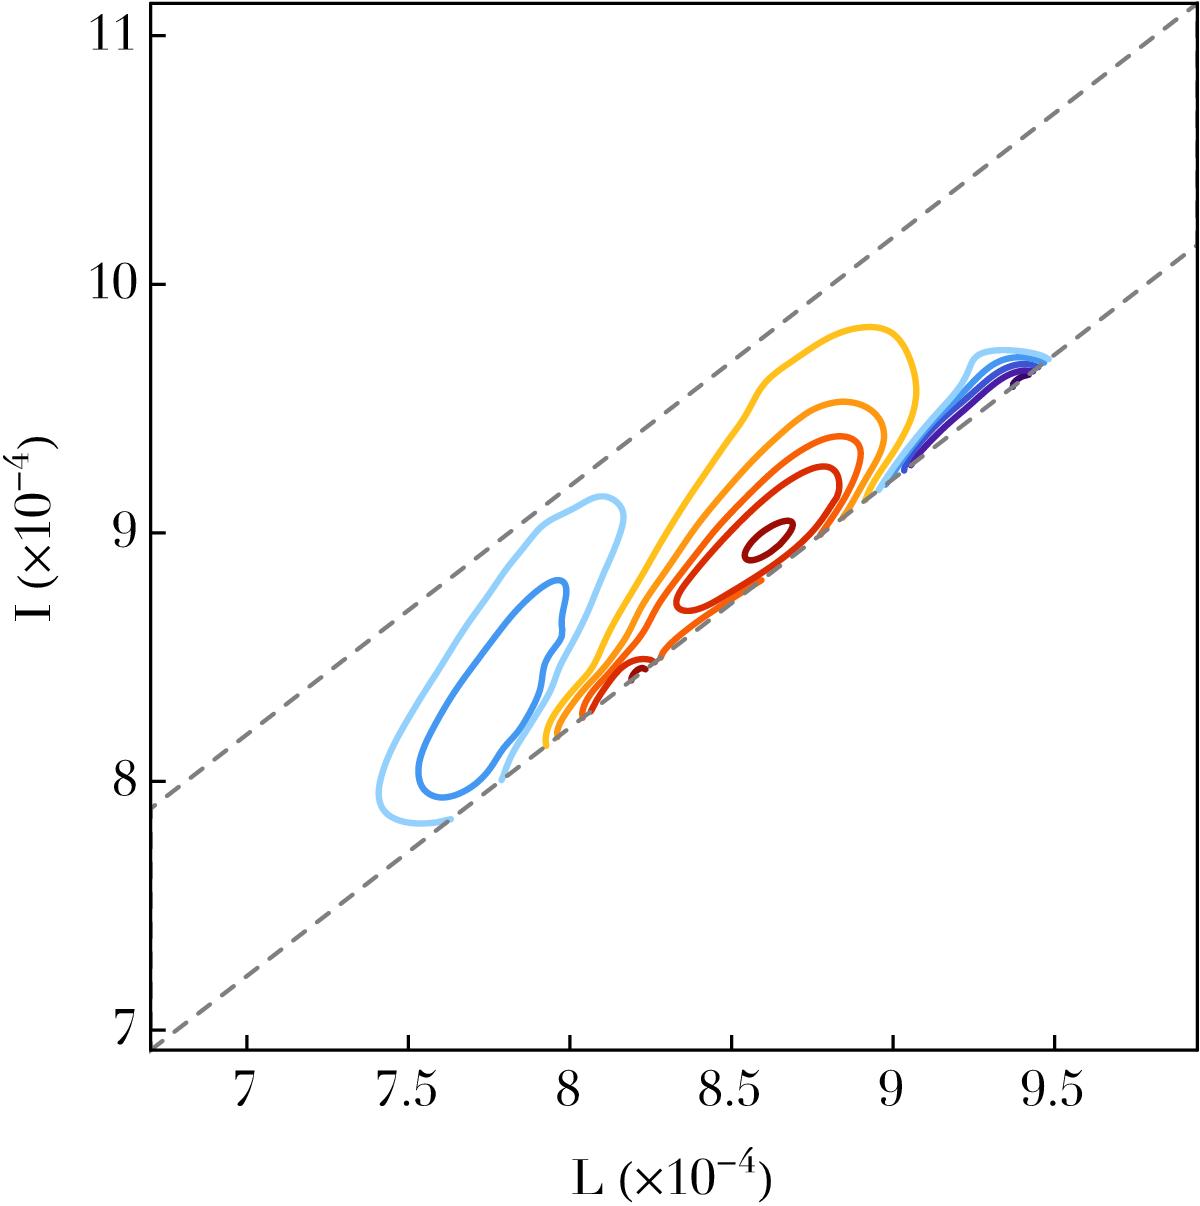
Divergence of the diffusion flux, div(ℱtot), predicted by the degenerate Landau Eq. (26)for the razor-thin quasi-Keplerian disc introduced in Sect. 2.2. Red contours, for which div(ℱtot) < 0, correspond to regions from which the wires will be depleted, whereas blue contours, for which div(ℱtot) > 0, are associated with regions in action space, where the value of the disc’s DF will increase during the resonant relaxation. The contours are spaced linearly between the minimum and the maximum of div(ℱtot). Within the units of Eq. (6), the maximum value for the positive blue contours is given by div(ℱtot)max ≃ 5 × 10-14, while the minimum value for the negative red contours reads div(ℱtot)min ≃ −10-13.
Current usage metrics show cumulative count of Article Views (full-text article views including HTML views, PDF and ePub downloads, according to the available data) and Abstracts Views on Vision4Press platform.
Data correspond to usage on the plateform after 2015. The current usage metrics is available 48-96 hours after online publication and is updated daily on week days.
Initial download of the metrics may take a while.