Fig. 16
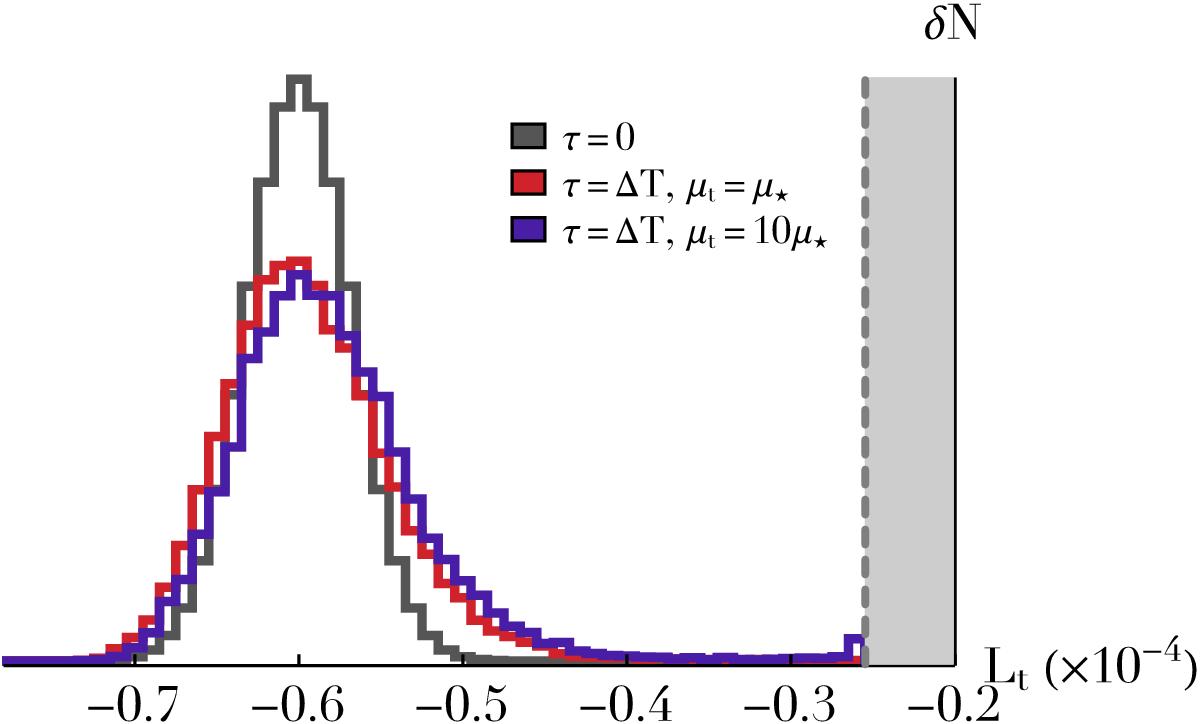
Diffusion of two populations of retrograde test stars of different individual mass. The two populations are initially distributed according to the same PDF, illustrated with the black histogram. The evolution of each test star is described by the Langevin equation associated with the Fokker-Planck Eq. (72). After a time ΔT = 200, the PDF of the light population (of individual mass μt = μ⋆) is given by the red histogram, while the heavy population (of individual mass μt = 10μ⋆) follows the PDF given by the blue histogram. Because of the prefactor (μt/μ⋆) present in Eq. (72), populations of different individual mass do not follow the same stochastic motions, and the system undergoes a mass segregation. Light (red) wires tend to become less eccentric and heavy (blue) wires tend to become more eccentric.
Current usage metrics show cumulative count of Article Views (full-text article views including HTML views, PDF and ePub downloads, according to the available data) and Abstracts Views on Vision4Press platform.
Data correspond to usage on the plateform after 2015. The current usage metrics is available 48-96 hours after online publication and is updated daily on week days.
Initial download of the metrics may take a while.