Fig. 10
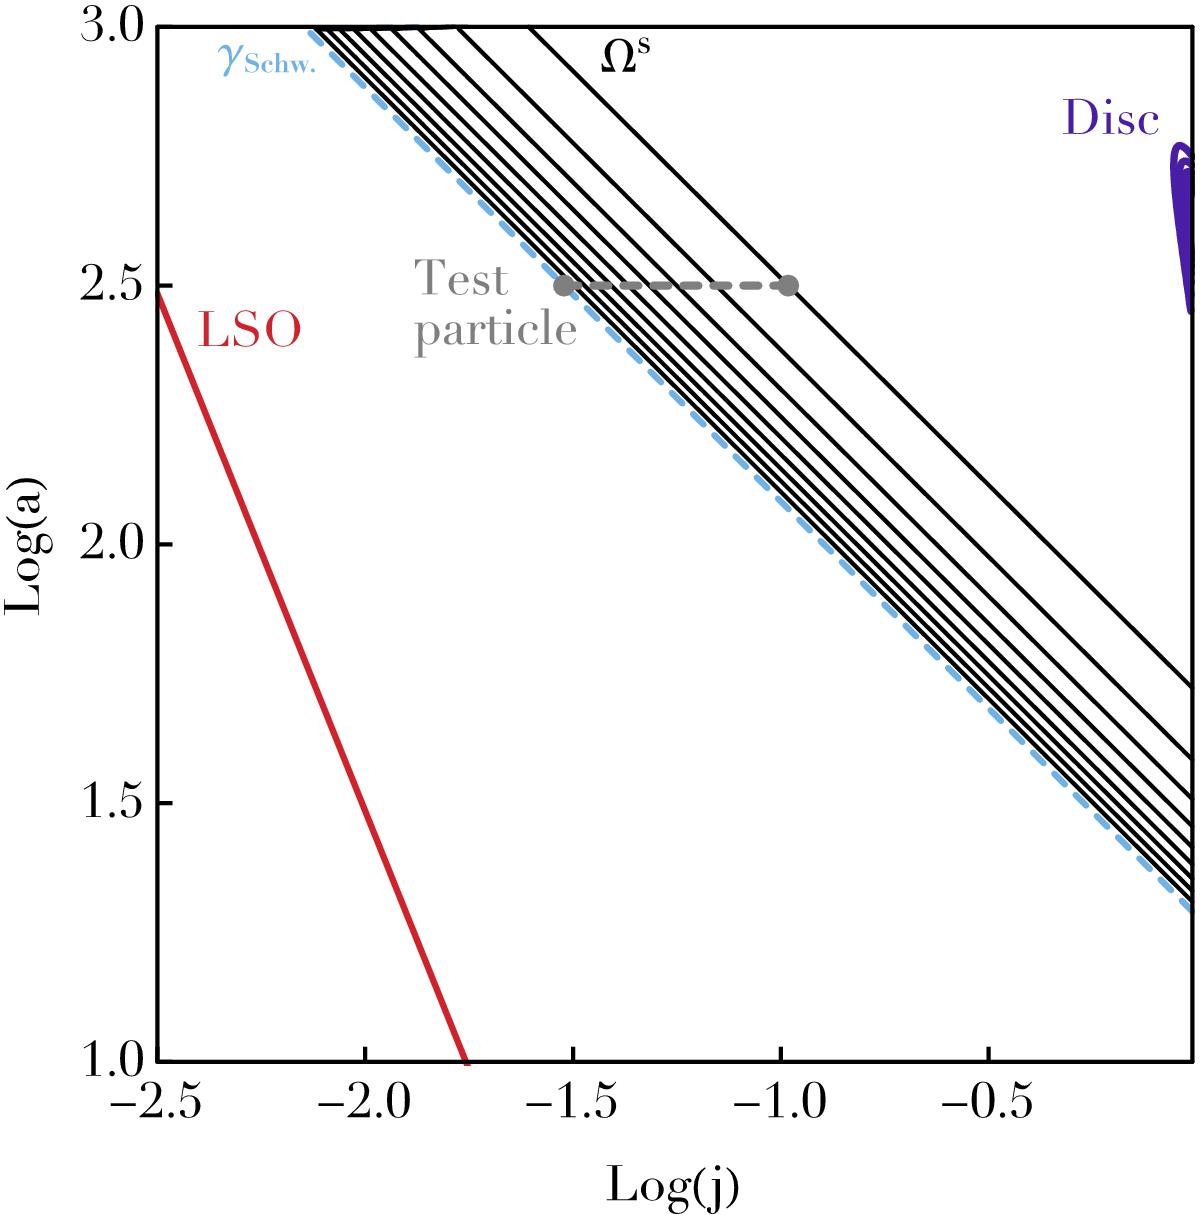
Diffusion of an individual test wire in the (j,a) = (L/I,I2/ (GM•))-space. Because of the adiabatic conservation of the fast action I, wires diffuse on horizontal lines. The red line corresponds to the last stable orbit (LSO), aLSO(j) = Rg(4 /j)2, with Rg = GM•/c2 (Bar-Or & Alexander 2016). The contours of the disc’s DF, F⋆, introduced in Eq. (8)are represented by the blue lines. The background lines correspond to some of the level lines of the precession frequency ![]() , which are dominated by the relativistic precession
, which are dominated by the relativistic precession ![]() for such eccentric orbits. These contours are computed for a retrograde test star, and are therefore associated with negative precession frequencies. They are spaced linearly between the maximum and the minimum precession frequency in the region of the disc, which are dominated by the self-consistent precession
for such eccentric orbits. These contours are computed for a retrograde test star, and are therefore associated with negative precession frequencies. They are spaced linearly between the maximum and the minimum precession frequency in the region of the disc, which are dominated by the self-consistent precession ![]() . The dashed grey line corresponds to the segment along which the drift and diffusion coefficients for the test wire are computed in Fig. 11. (Recall that the test star is assumed to be retrograde, i.e. Lt< 0, but for clarity, it is represented on the same diagram than the disc.) The cyan line illustrates the location of the Schwarzschild barrier, γSchw., for retrograde test stars defined in Eq. (71). Retrograde test wires to the left of this barrier will precess too fast to resonate with this disc, see Figs. 11 and 12. Such wires do not undergo any resonant relaxation, and can only diffuse as a result of additional diffusion mechanisms, such as two-body non-resonant relaxation.
. The dashed grey line corresponds to the segment along which the drift and diffusion coefficients for the test wire are computed in Fig. 11. (Recall that the test star is assumed to be retrograde, i.e. Lt< 0, but for clarity, it is represented on the same diagram than the disc.) The cyan line illustrates the location of the Schwarzschild barrier, γSchw., for retrograde test stars defined in Eq. (71). Retrograde test wires to the left of this barrier will precess too fast to resonate with this disc, see Figs. 11 and 12. Such wires do not undergo any resonant relaxation, and can only diffuse as a result of additional diffusion mechanisms, such as two-body non-resonant relaxation.
Current usage metrics show cumulative count of Article Views (full-text article views including HTML views, PDF and ePub downloads, according to the available data) and Abstracts Views on Vision4Press platform.
Data correspond to usage on the plateform after 2015. The current usage metrics is available 48-96 hours after online publication and is updated daily on week days.
Initial download of the metrics may take a while.