Fig. 4
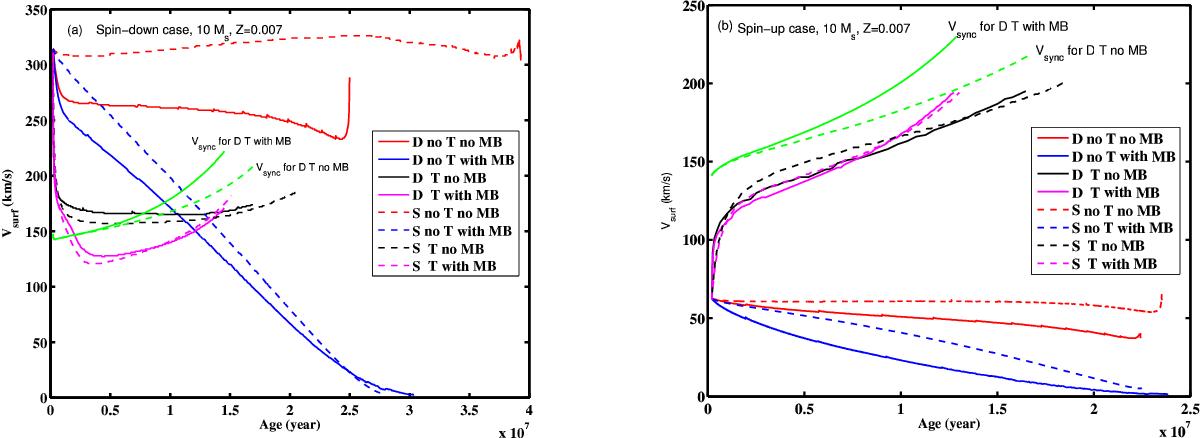
Evolution of the surface equatorial velocity as a function of time for different 10 M⊙ stellar models at a metallicity Z = 0.007. The continuous curves show the results when the internal angular momentum transport mechanisms are moderate and allow differential (D) rotation to set up inside the star. The dashed lines show the situation when, due to a very efficient angular momentum transport mechanism, the stars rotate nearly as solid bodies (hence the S labeling the dashed curves). The red curves show the evolution in the case where the star is single (“no T” means “no tidal interaction”) and with no magnetic braking (“no MB”). The continuous blue curve shows the situation when magnetic braking is accounted for assuming a constant equatorial surface magnetic field of 1 kG. The black and magenta continuous curves are for the same 10 M⊙ star, now as the primary star in a close binary system with a companion of 7 M⊙ and an initial orbital period of 1.2 days. The black and magenta curves are for models without and with magnetic braking, respectively. The green curves indicate the evolution of the synchronization velocity for the differentially rotating models (the cases for solid rotation are not shown so as to not overcrowd the picture). Left panel: the star begins its evolution with a rotation on the ZAMS equal to 310 km s-1. In the close binary considered, the star is being spun down by the tidal forces. Right panel: the star begins its evolution with a rotation on the ZAMS equal to 60 km s-1. In the close binary considered, the star is being spun up by the tidal forces.
Current usage metrics show cumulative count of Article Views (full-text article views including HTML views, PDF and ePub downloads, according to the available data) and Abstracts Views on Vision4Press platform.
Data correspond to usage on the plateform after 2015. The current usage metrics is available 48-96 hours after online publication and is updated daily on week days.
Initial download of the metrics may take a while.