Fig. 9
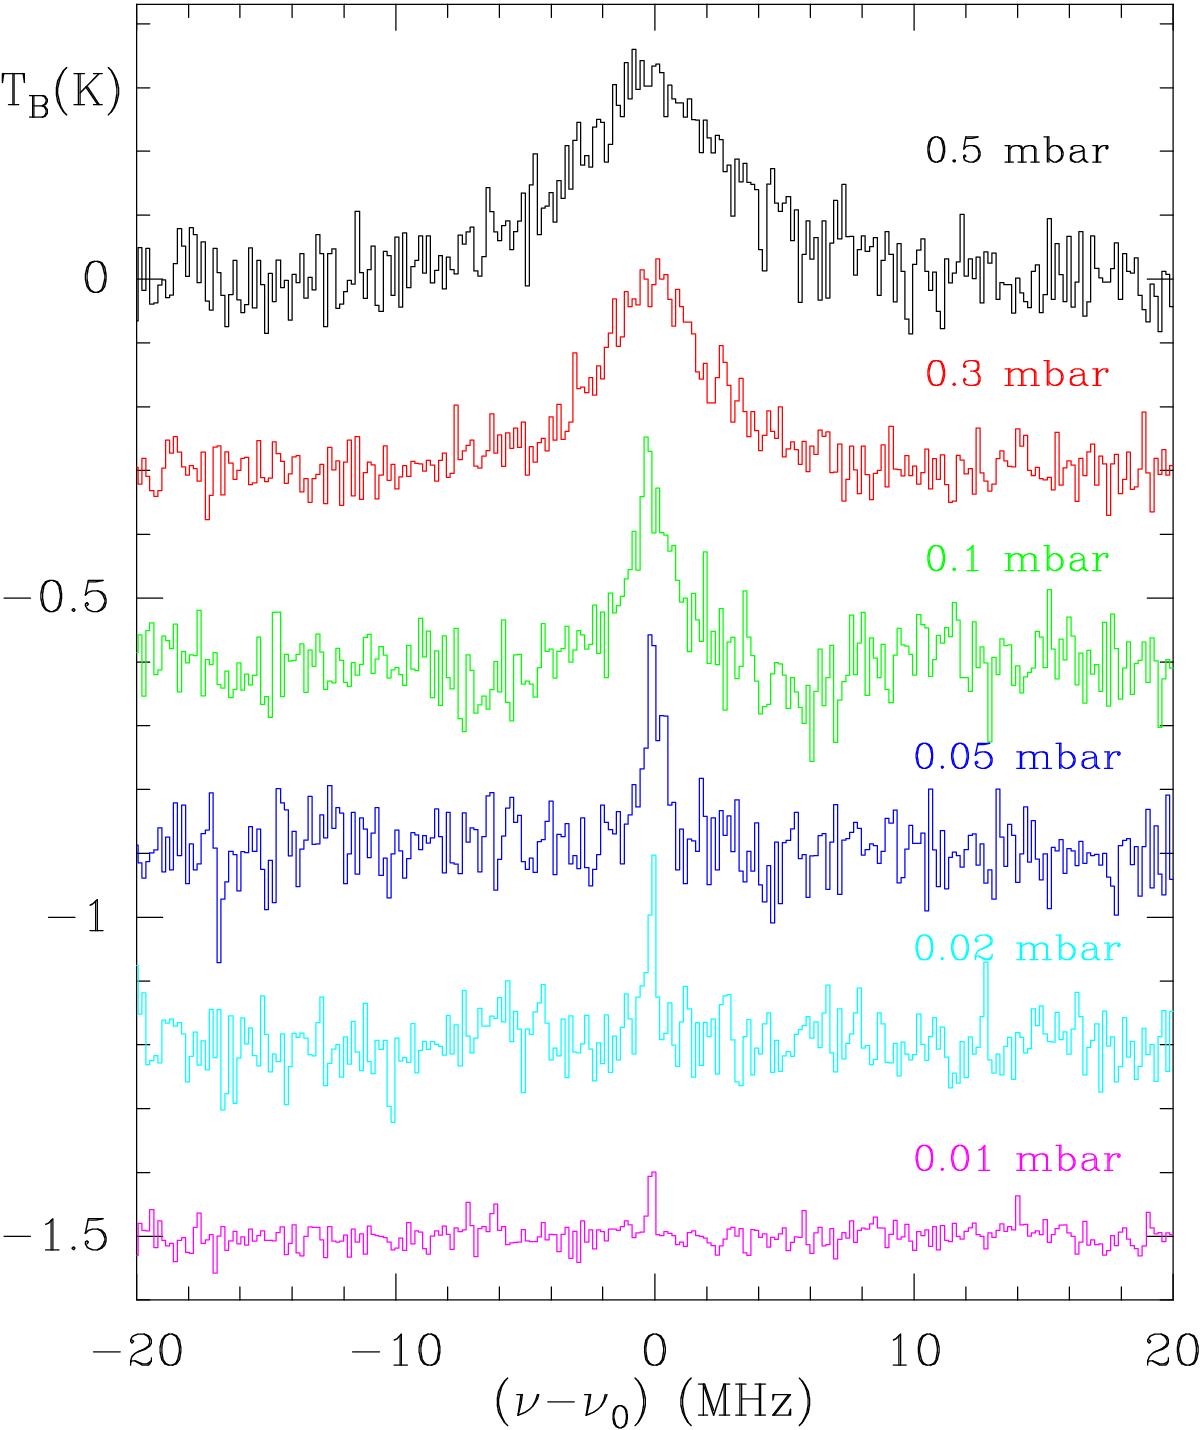
Observed line of methanol at 44 069 MHz (70,7−61,6A+ transition) for different values of the total gas pressure. The integration time was 40 min for the narrower feature. The spectral resolution is 180 kHz obtained by a five channel smoothing of the original data. A shift by −0.3 K is introduced in the vertical scale of each spectrum with respect to the previous one, as pressure decreases.
Current usage metrics show cumulative count of Article Views (full-text article views including HTML views, PDF and ePub downloads, according to the available data) and Abstracts Views on Vision4Press platform.
Data correspond to usage on the plateform after 2015. The current usage metrics is available 48-96 hours after online publication and is updated daily on week days.
Initial download of the metrics may take a while.