Fig. 7
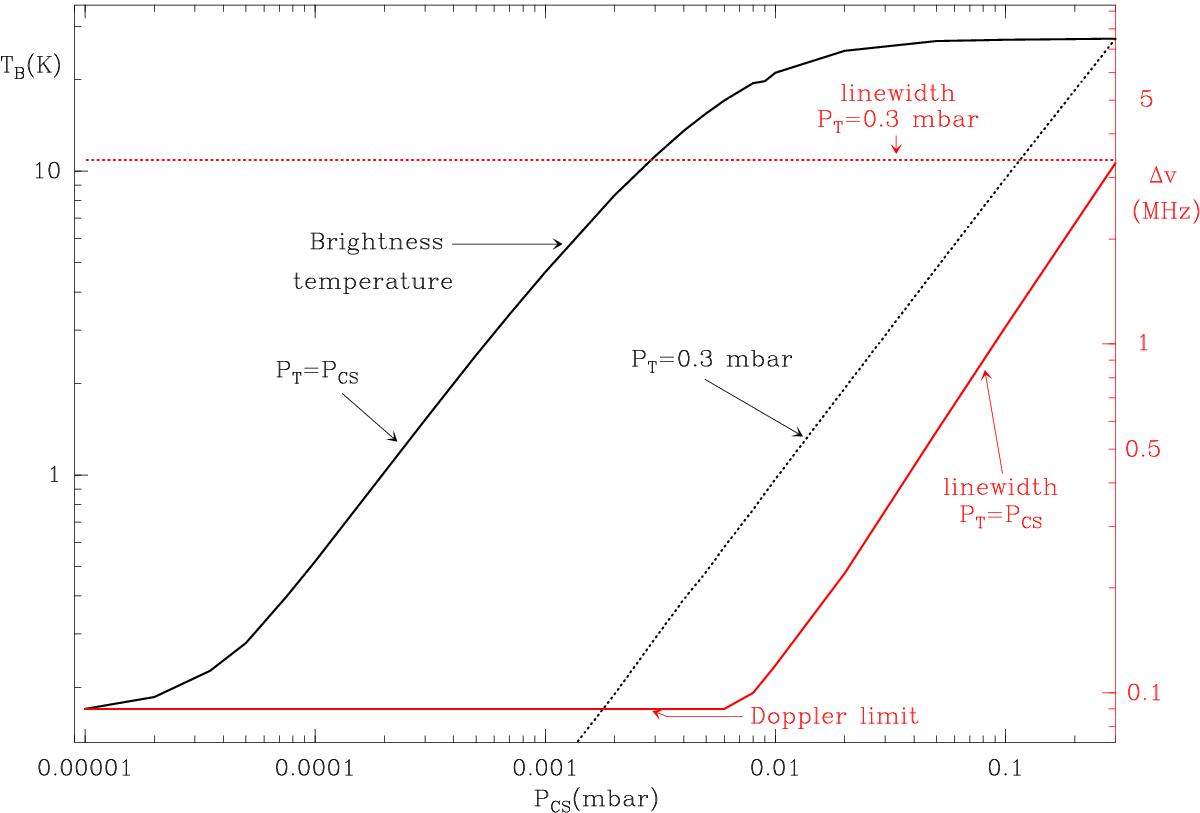
Expected brightness temperature (black lines) and linewidth (red lines) for the CS J = 1−0 line for two different cases. The continuous lines correspond to the cell filled only with CS and PT = PCS, while the dashed lines correspond to a cell filled with N2 and CS at a total constant pressure of 0.3 mbar. The x-axis corresponds to the partial pressure of CS.
Current usage metrics show cumulative count of Article Views (full-text article views including HTML views, PDF and ePub downloads, according to the available data) and Abstracts Views on Vision4Press platform.
Data correspond to usage on the plateform after 2015. The current usage metrics is available 48-96 hours after online publication and is updated daily on week days.
Initial download of the metrics may take a while.