Fig. 16
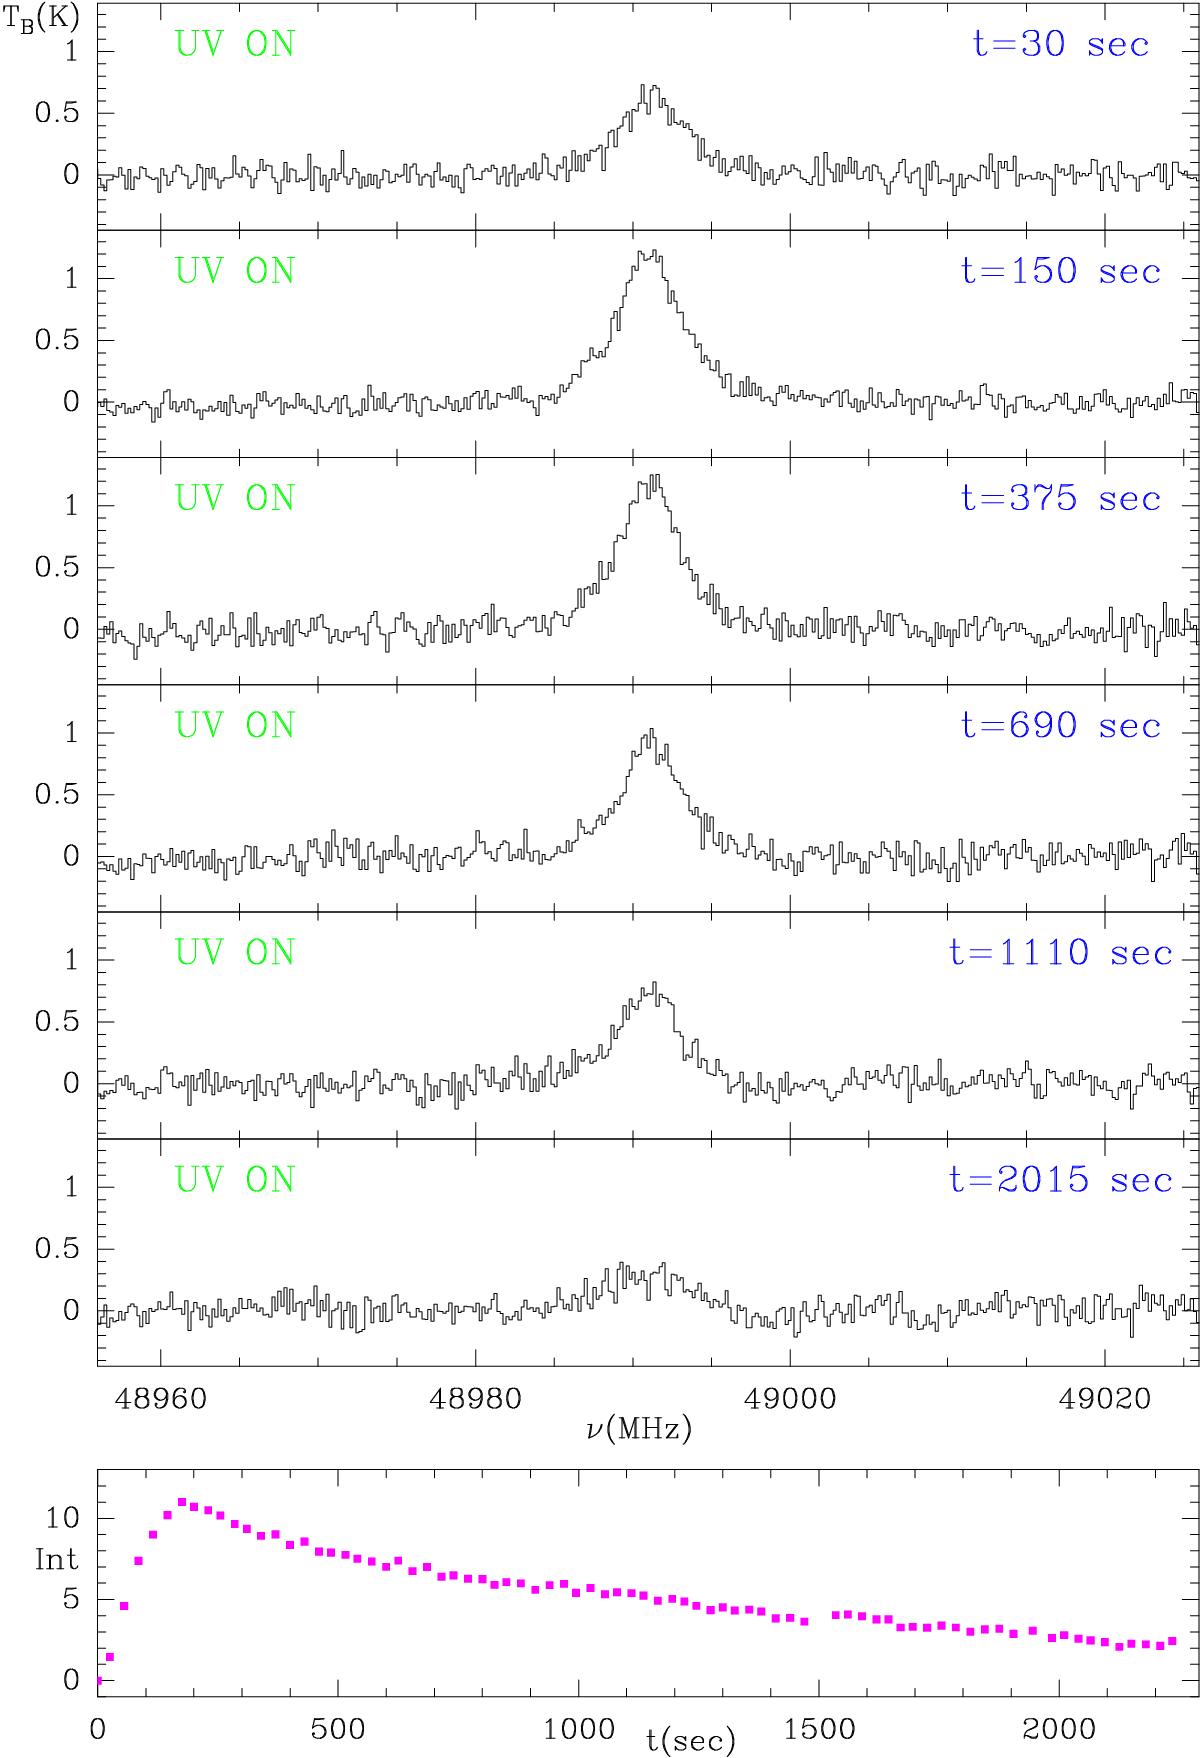
Observed J = 1−0 CS transition at 48 990.957 MHz using the UV lamp. The integration time was 20 s per spectra. The spectral resolution of the data is 190 kHz. The upper panels show spectra at selected times while the lower panel shows the line integrated intensity (K × MHz) as a function of time. A video showing the whole set of data is available online.
Current usage metrics show cumulative count of Article Views (full-text article views including HTML views, PDF and ePub downloads, according to the available data) and Abstracts Views on Vision4Press platform.
Data correspond to usage on the plateform after 2015. The current usage metrics is available 48-96 hours after online publication and is updated daily on week days.
Initial download of the metrics may take a while.