Fig. 10
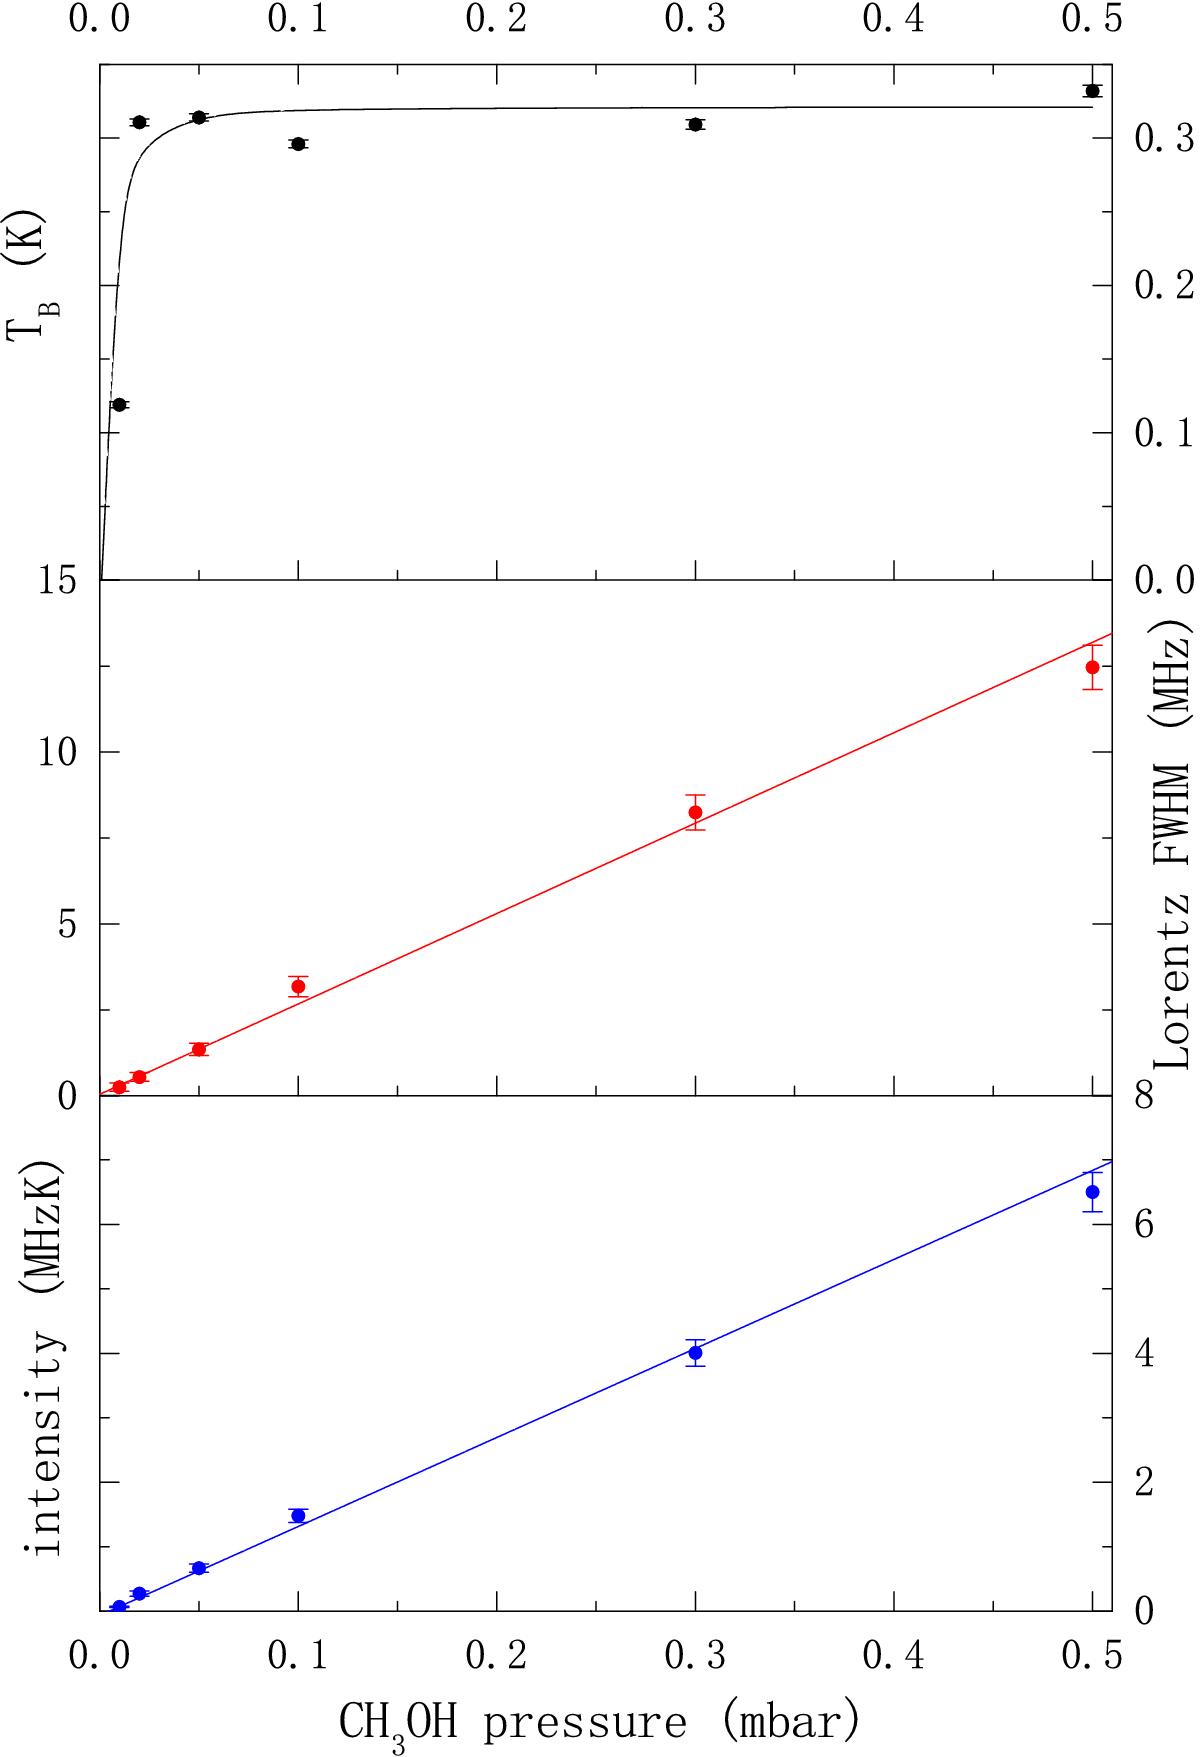
Symbols (from top to bottom): peak intensity, collisional linewidth and integrated intensity derived from Voigt fits to the observed methanol line (70,7−61,6, A+); data from Fig. 9. In all fits the Gaussian width was fixed to the calculated value. Solid lines (from top to bottom): calculated peak intensity with the calculated broadening coefficient, and intensity, best fit of the collisional widths vs. pressure (the slope yields a broadening coefficient ΔνC = 13.2 ± 0.6 MHz/mbar) and best fit of the integrated line intensity vs. pressure.
Current usage metrics show cumulative count of Article Views (full-text article views including HTML views, PDF and ePub downloads, according to the available data) and Abstracts Views on Vision4Press platform.
Data correspond to usage on the plateform after 2015. The current usage metrics is available 48-96 hours after online publication and is updated daily on week days.
Initial download of the metrics may take a while.