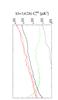
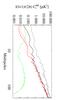
Fig. 8

BB angular power spectra from S (on the top) and S+N (on the bottom) residual maps for the minimal case of one detector and one operation day. HWP stepped every 60 s with a telescope scanning rate of 12 deg/s (solid black line); HWP stepped every 3600 s with a telescope scanning rate of 0.7 deg/s (dashed black line); HWP spinning at 5 Hz with a telescope scanning rate of 0.7 deg/s (solid red line); HWP spinning at 0.5 Hz with a telescope scanning rate of 12 deg/s (dashed red line). The BB spectrum from the input map is shown for comparison by the green dot-dashed line (in the S case the spectrum is rescaled down by a factor of 102).
Current usage metrics show cumulative count of Article Views (full-text article views including HTML views, PDF and ePub downloads, according to the available data) and Abstracts Views on Vision4Press platform.
Data correspond to usage on the plateform after 2015. The current usage metrics is available 48-96 hours after online publication and is updated daily on week days.
Initial download of the metrics may take a while.