Free Access
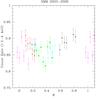
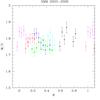
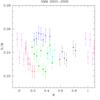
Fig. 1
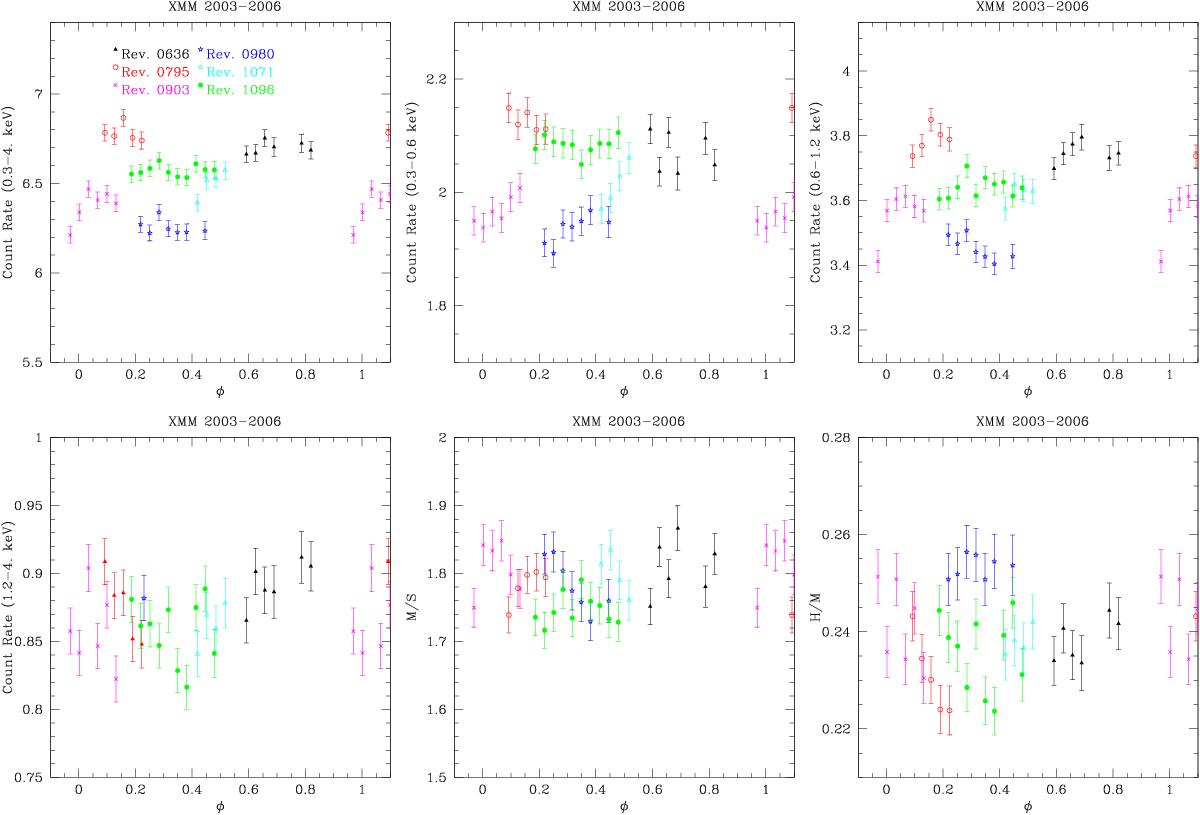
Count rates in several energy bands of ζ Pup, and associated hardness ratios for XMM-Newton data from 2003–2006. The phases were calculated using P = 1.780938 d and T0 = 2 450 000 (Howarth & Stevens 2014). To facilitate the comparisons, the ratio between upper and lower limits of the y-axes are all equal.
This figure is made of several images, please see below:
Current usage metrics show cumulative count of Article Views (full-text article views including HTML views, PDF and ePub downloads, according to the available data) and Abstracts Views on Vision4Press platform.
Data correspond to usage on the plateform after 2015. The current usage metrics is available 48-96 hours after online publication and is updated daily on week days.
Initial download of the metrics may take a while.