Fig. 5
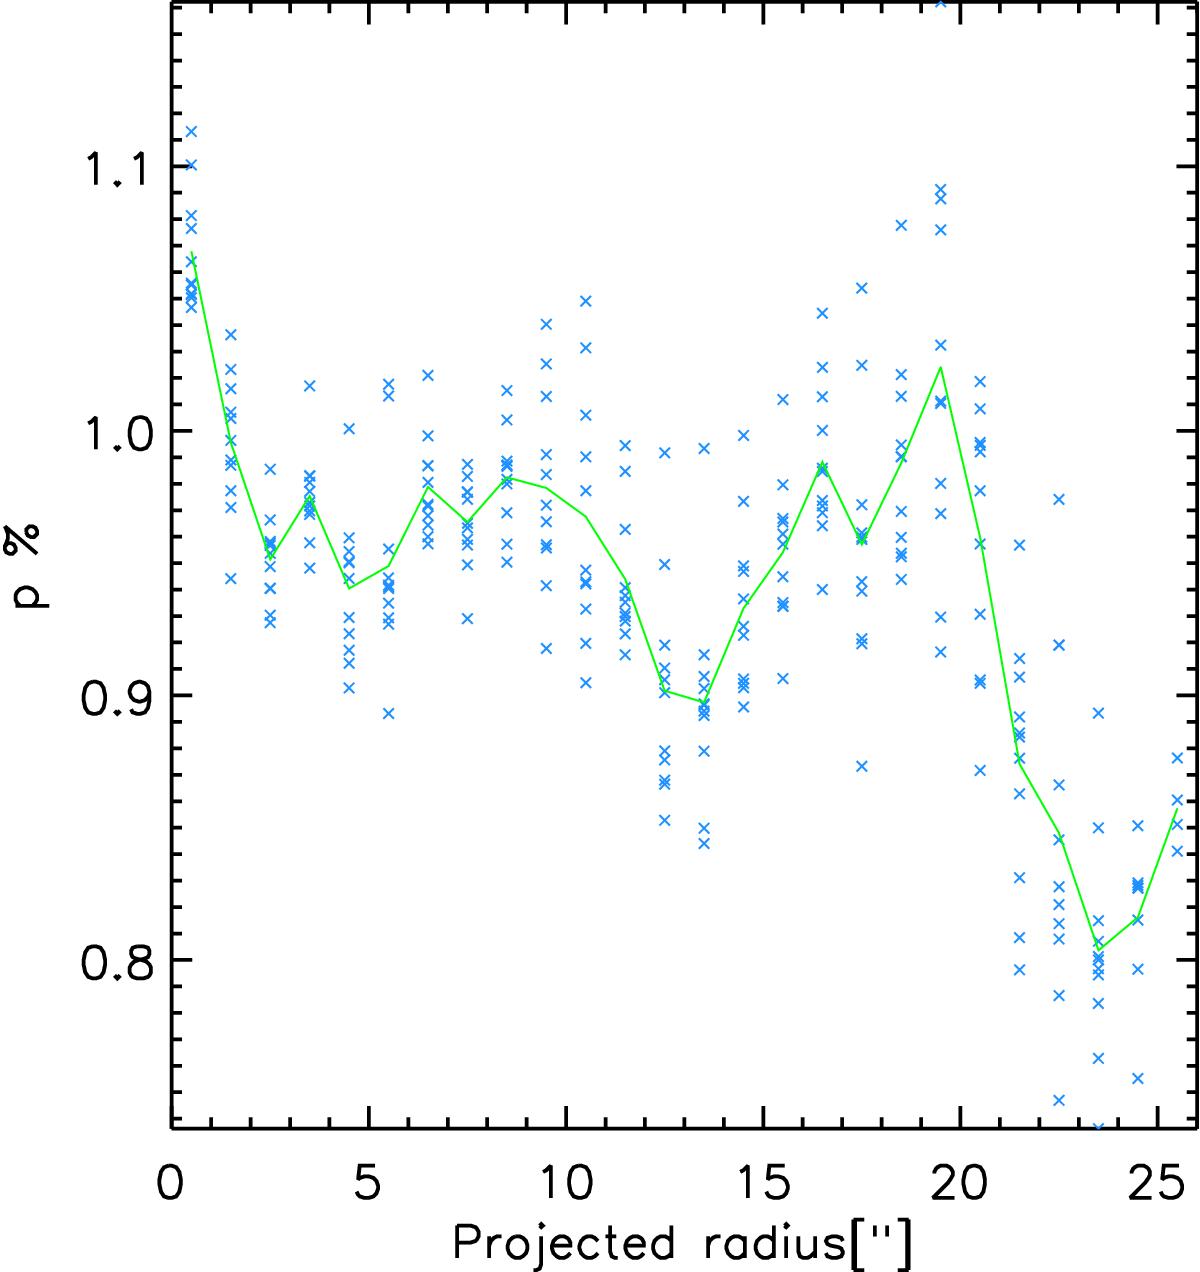
Relative detection frequency due to extinction versus projected distance to Sgr A*, in pointing 1 for min_correlation = 0.8 and deblend = 0. The blue crosses give the values of p for each magnitude bin. The green line represents the mean of the p(%) considering detected stars at the same distance from Sgr A*. We can observe that for close distances to Sgr A*p(%) is higher than for large distances, as we expected, because the extinction near Sg A* is lower.
Current usage metrics show cumulative count of Article Views (full-text article views including HTML views, PDF and ePub downloads, according to the available data) and Abstracts Views on Vision4Press platform.
Data correspond to usage on the plateform after 2015. The current usage metrics is available 48-96 hours after online publication and is updated daily on week days.
Initial download of the metrics may take a while.