Fig. 2
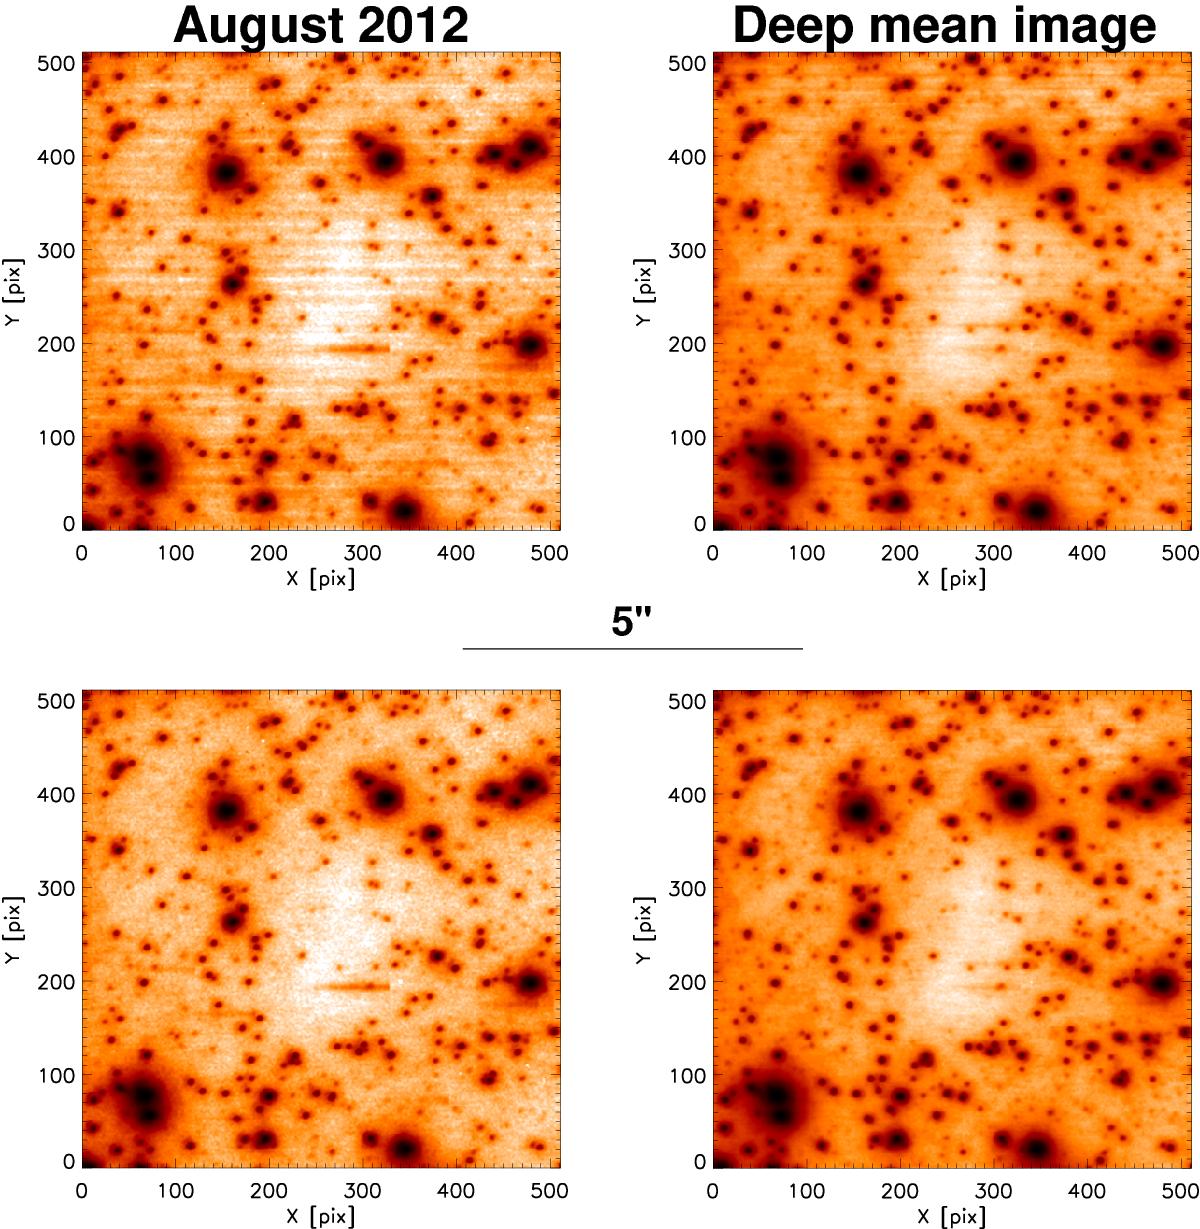
Cleaning of horizontal stripes (systematic readout noise). Upper left: detail of August 2012 Ks-band image. Lower left: as upper left, but cleaned. Upper right: detail of deep, mean combined Ks-band image when the input images have not been cleaned. Lower right: detail of deep, mean combined Ks-band image after cleaning of the input images. The displayed field is located about 12.0′′ and 1.7′′ north of Sgr A*. The colour scale is logarithmic and identical for all images.
Current usage metrics show cumulative count of Article Views (full-text article views including HTML views, PDF and ePub downloads, according to the available data) and Abstracts Views on Vision4Press platform.
Data correspond to usage on the plateform after 2015. The current usage metrics is available 48-96 hours after online publication and is updated daily on week days.
Initial download of the metrics may take a while.