Fig. 15
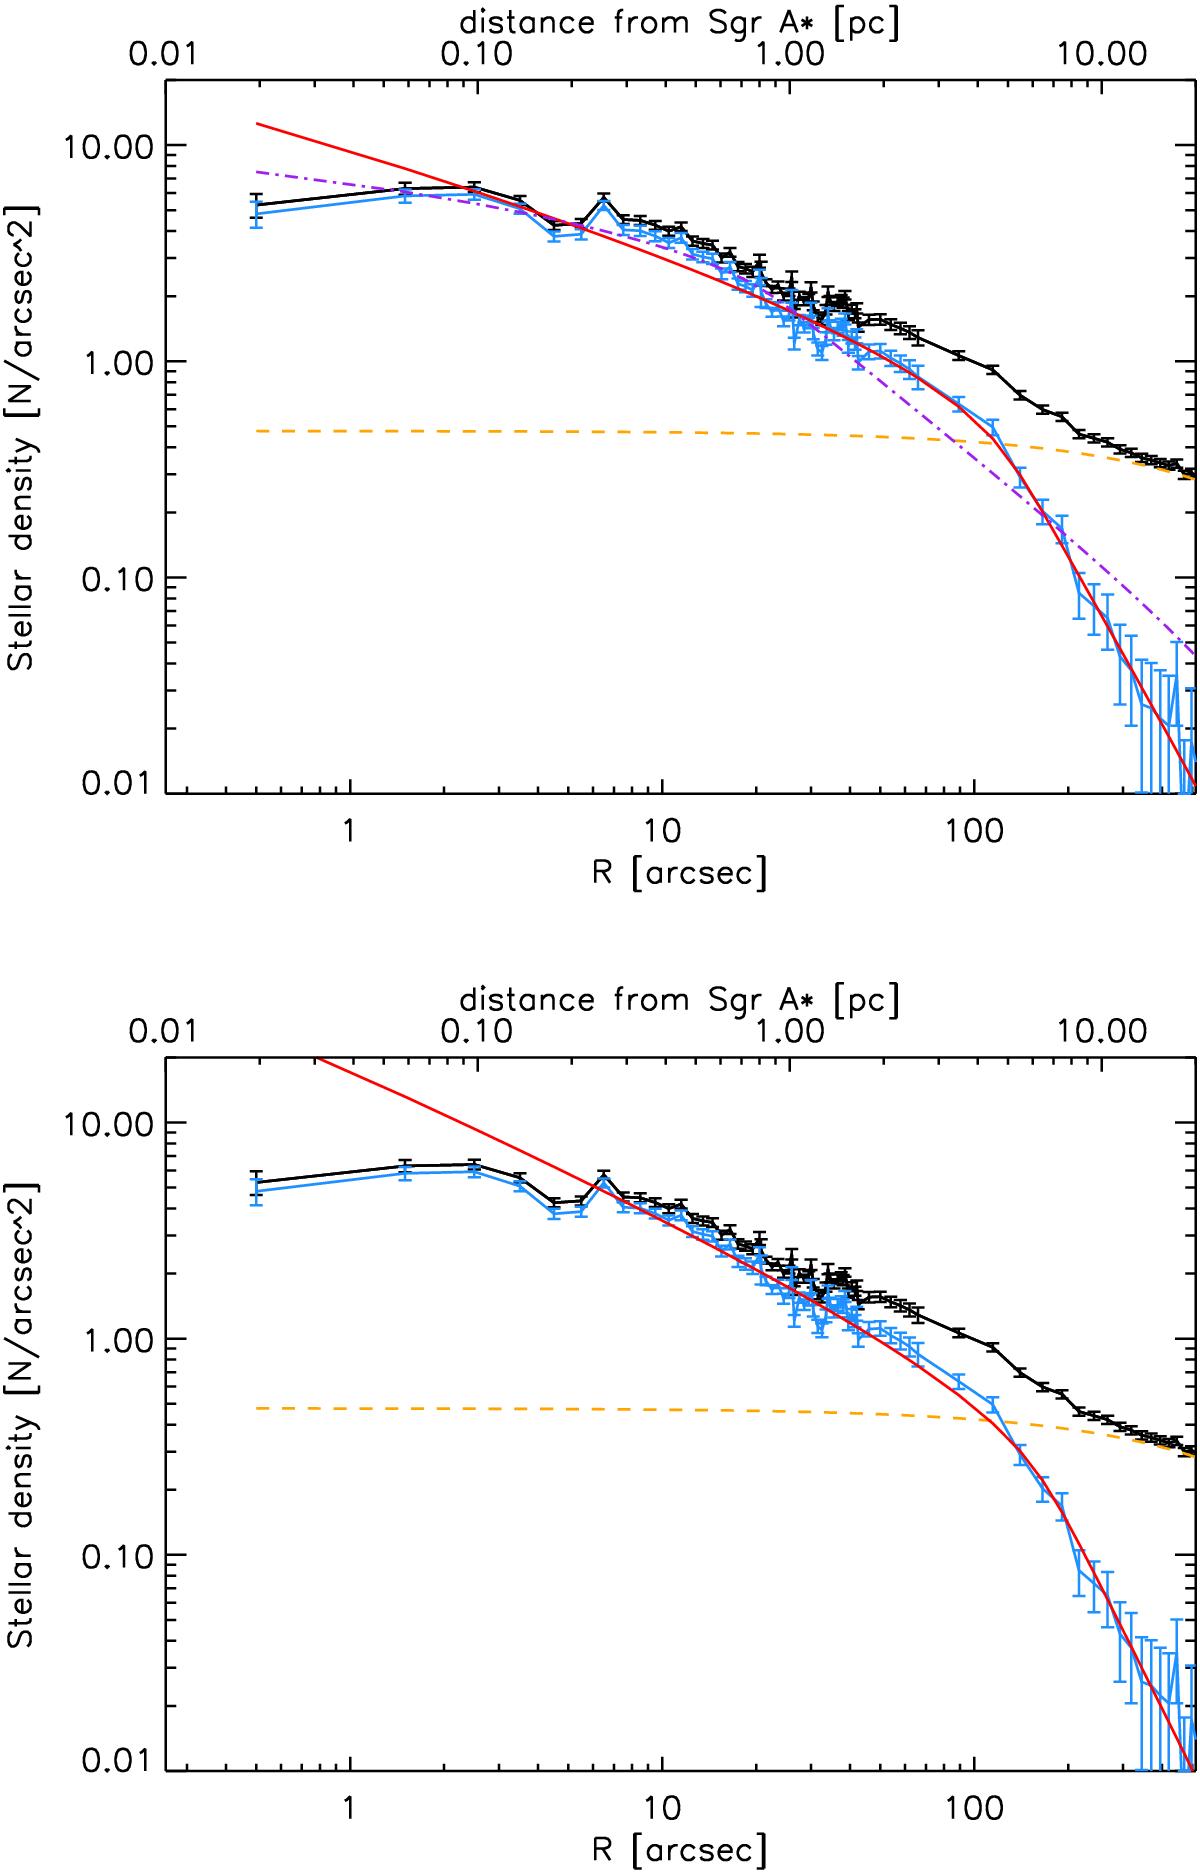
Upper panel: black: combined, corrected surface density data for stars in the magnitude interval 12.5 ≤ Ks ≤ 16 from our deep plus wide field image, complemented at large radii by scaled data from Fritz et al. (2016). The orange line is a model for the emission from the nuclear disc (model 5 in Table 2 of Schödel et al. 2014a) that is subtracted from the black data points, resulting in the blue data points. The red line is a Nuker model fit (ID 1 in Table 5). The dash-dotted purple line is a Nuker model fit with γ = 1.0 fixed (ID 7 in Table 5). Lower panel: like upper panel, but Nuker fit from ID 4 in Table 5.
Current usage metrics show cumulative count of Article Views (full-text article views including HTML views, PDF and ePub downloads, according to the available data) and Abstracts Views on Vision4Press platform.
Data correspond to usage on the plateform after 2015. The current usage metrics is available 48-96 hours after online publication and is updated daily on week days.
Initial download of the metrics may take a while.