Free Access
Fig. 9
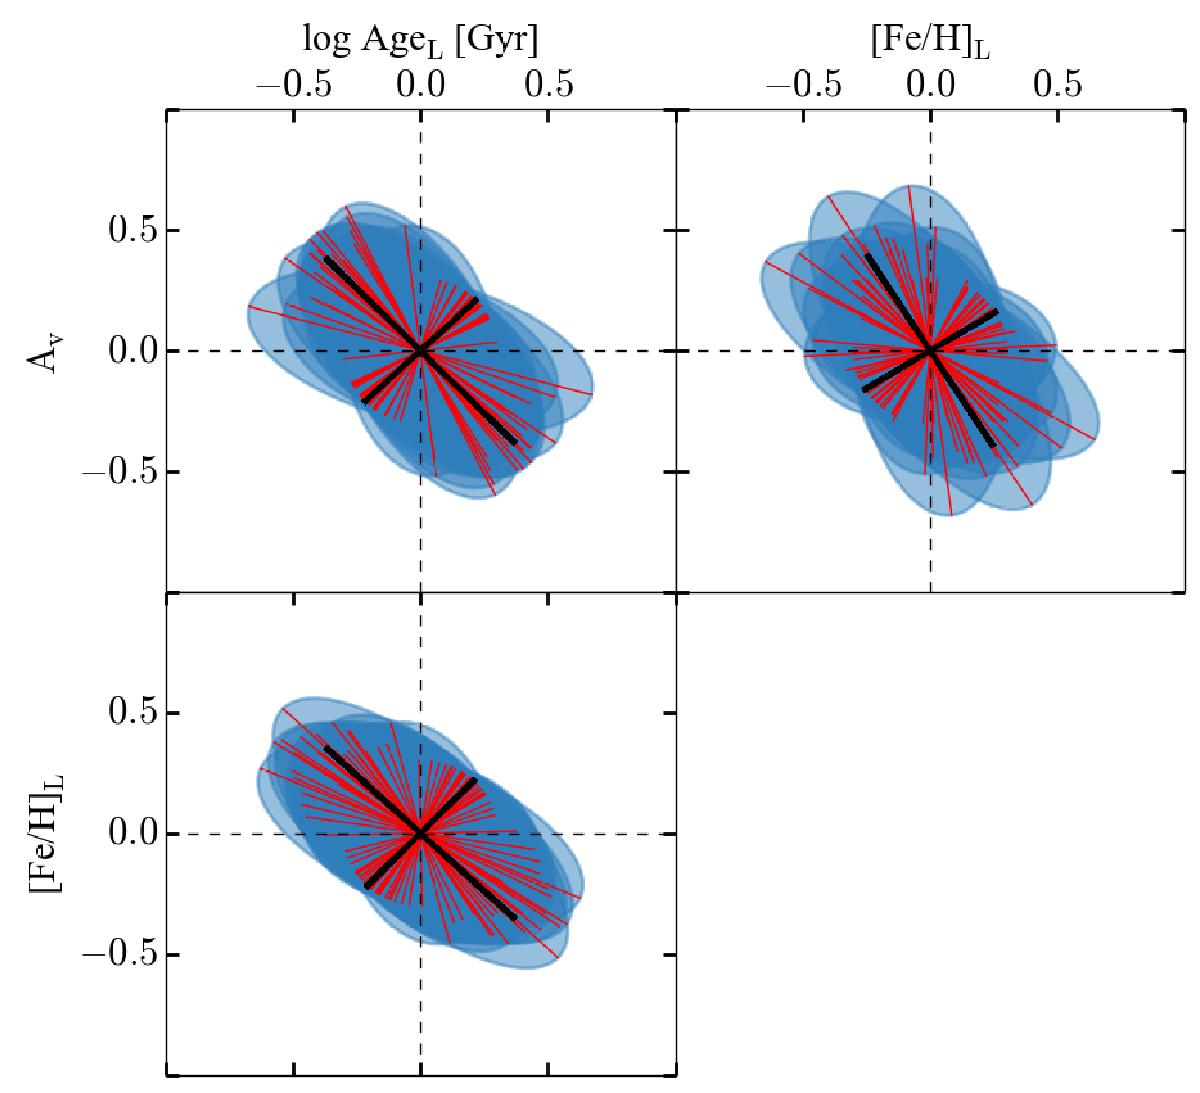
Stacked covariance error ellipses, at the 95% confidence level, of the stellar population parameters for all the objects in the sample. The red lines illustrate the minor and major axis of each ellipse, while the black lines correspond to the median values for the entire sample for E-MILES models.
Current usage metrics show cumulative count of Article Views (full-text article views including HTML views, PDF and ePub downloads, according to the available data) and Abstracts Views on Vision4Press platform.
Data correspond to usage on the plateform after 2015. The current usage metrics is available 48-96 hours after online publication and is updated daily on week days.
Initial download of the metrics may take a while.